
Brand Fit Snapshot
Best for:
Not ideal if:
Similar properties you might like:
Quick assessment - takes 30 seconds
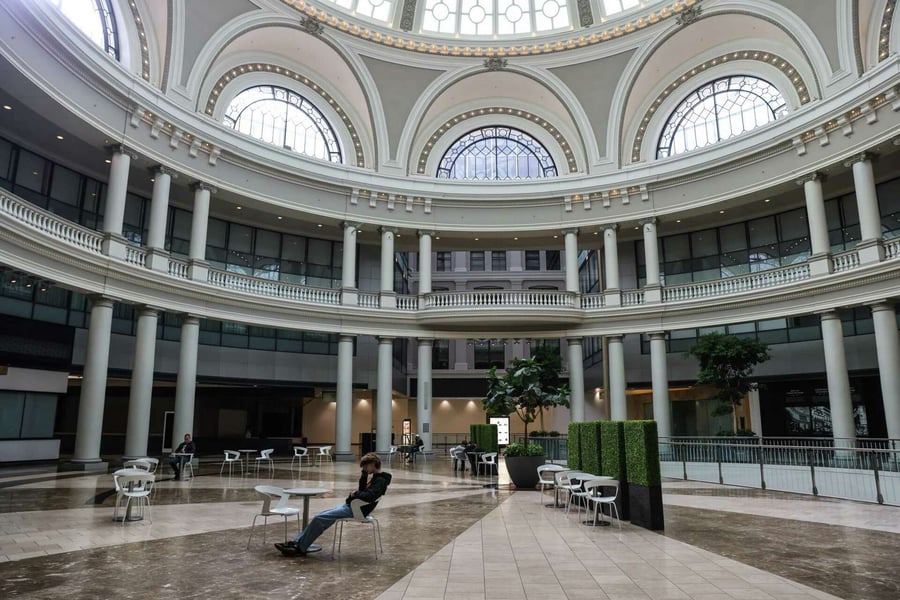
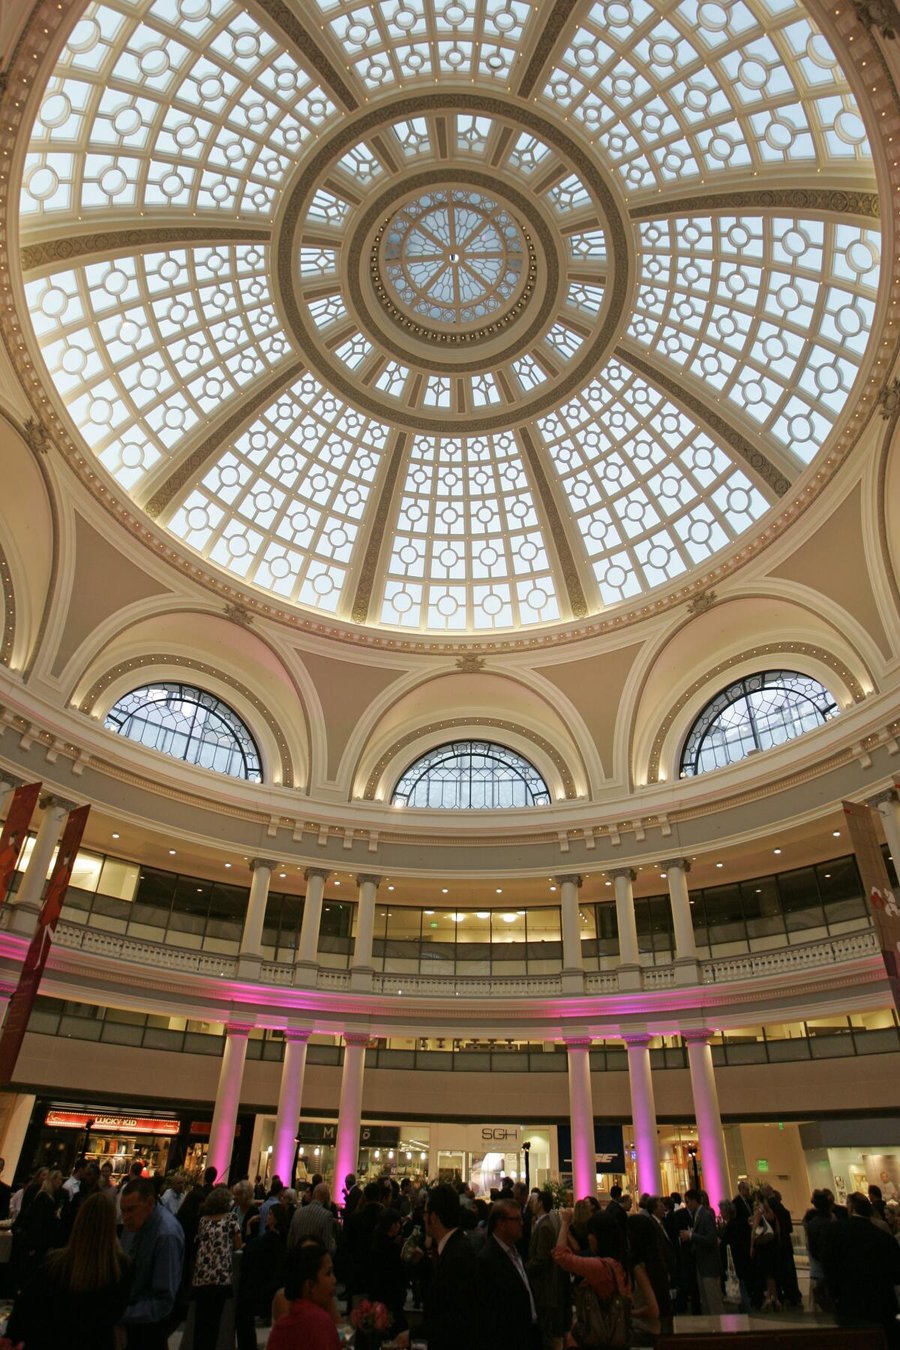
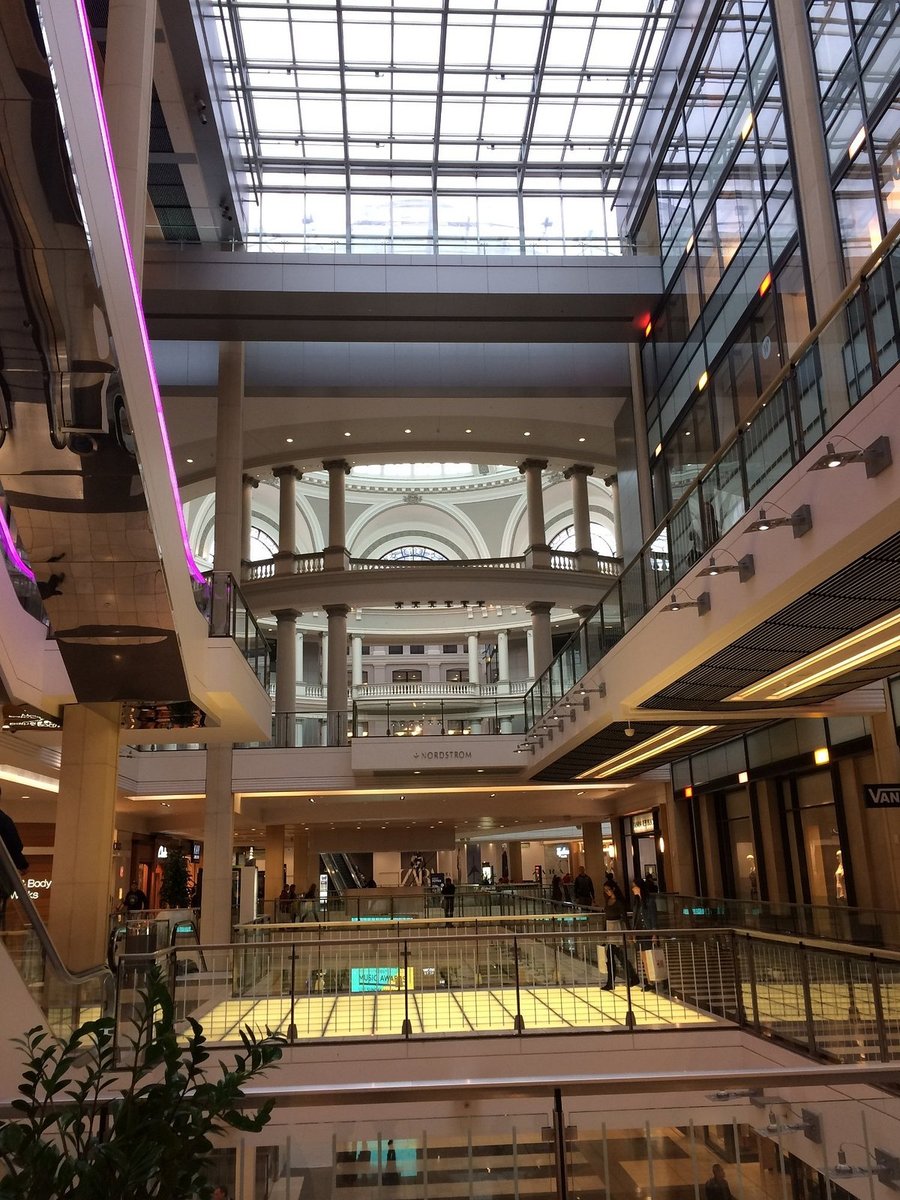
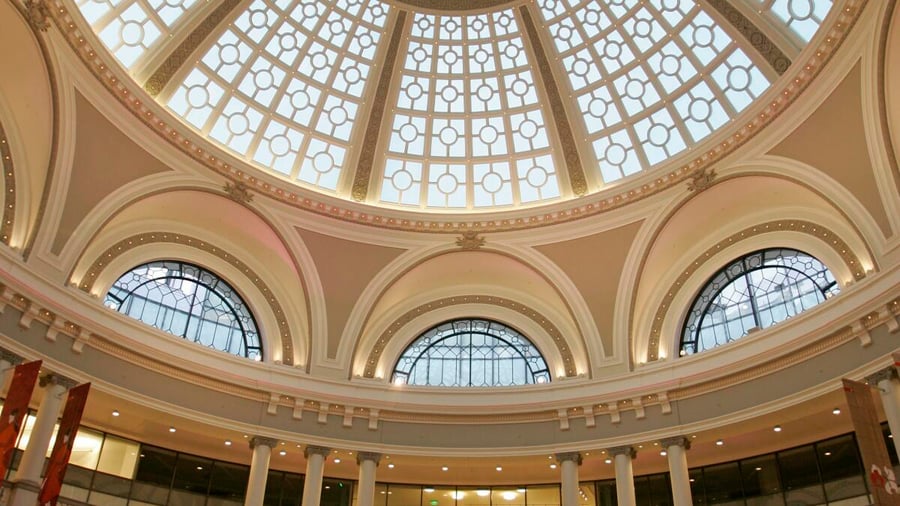
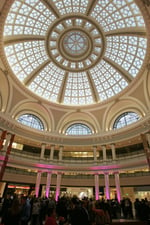
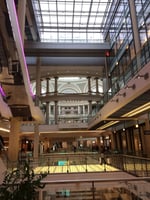
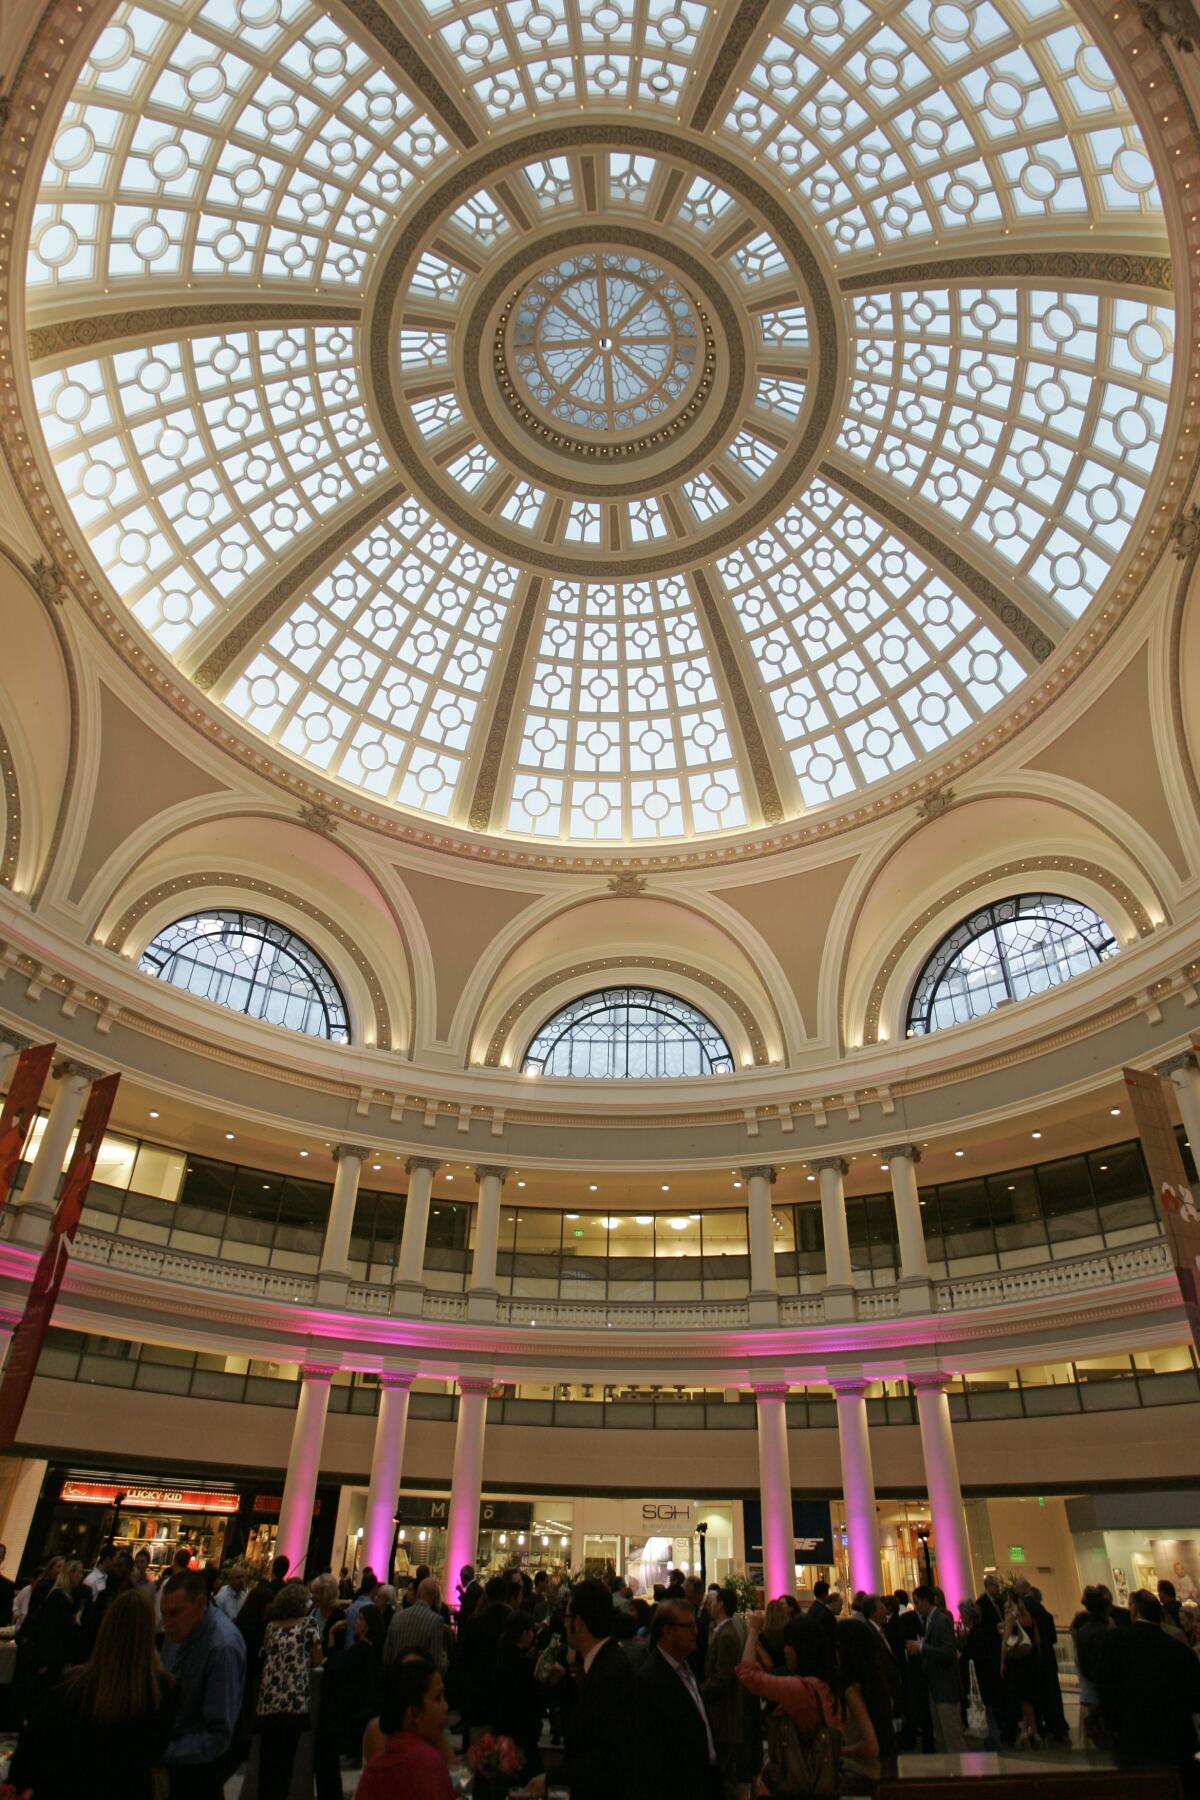
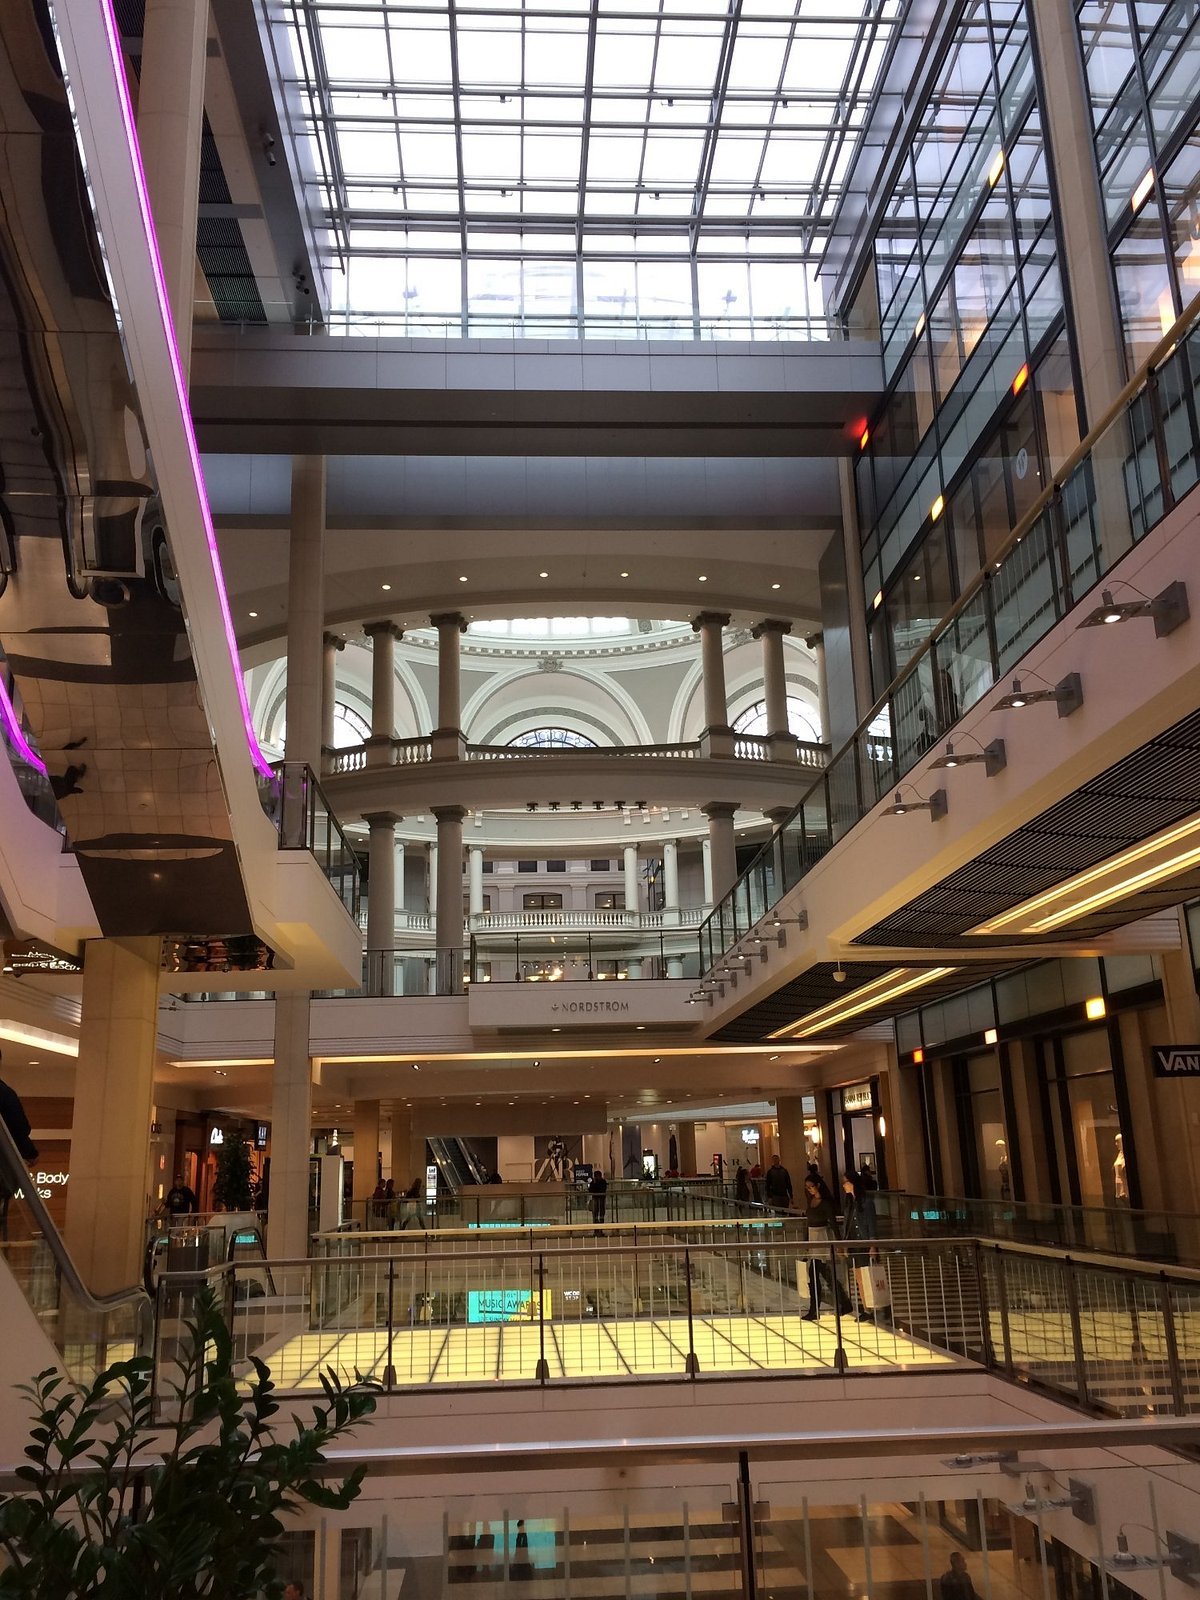
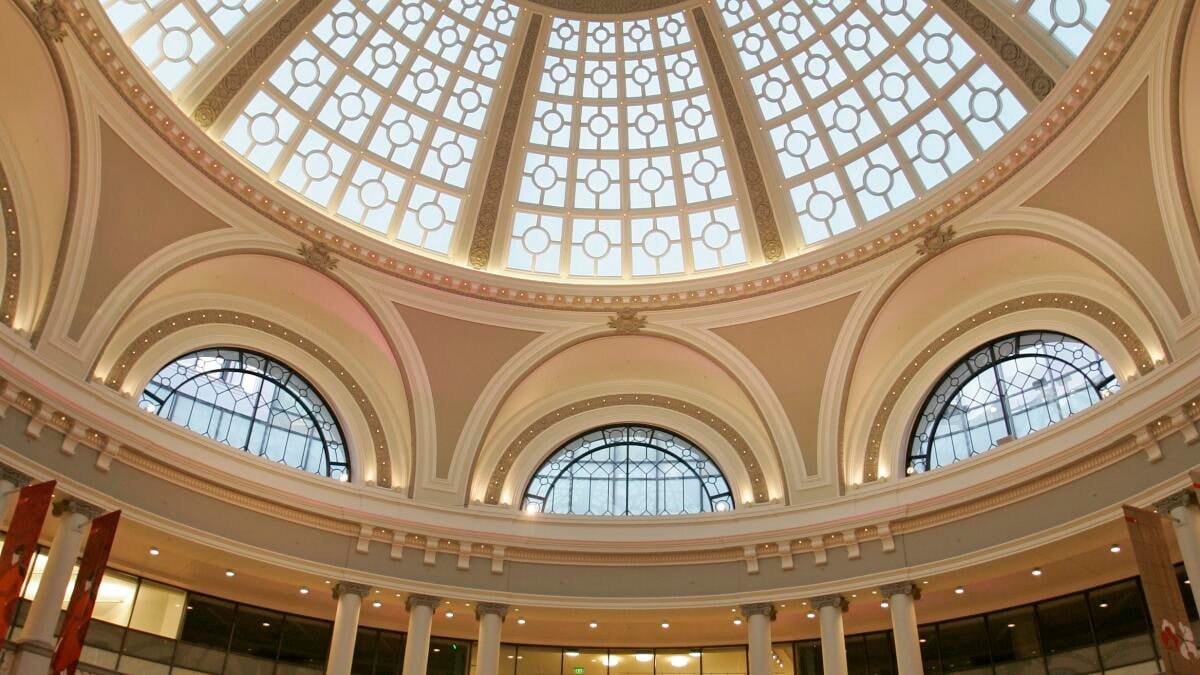
Westfield San Francisco Centre, located at 865 Market Street in downtown San Francisco, is a 1.1 million square foot vertical shopping center opened in 1988 and redeveloped in 2006. It connects directly to the Powell Street BART and Muni stations, providing excellent public transit access in the heart of the Union Square district. The property features a mix of retail levels including luxury brands, mid-tier apparel, and dining options, though it has faced significant challenges post-pandemic.
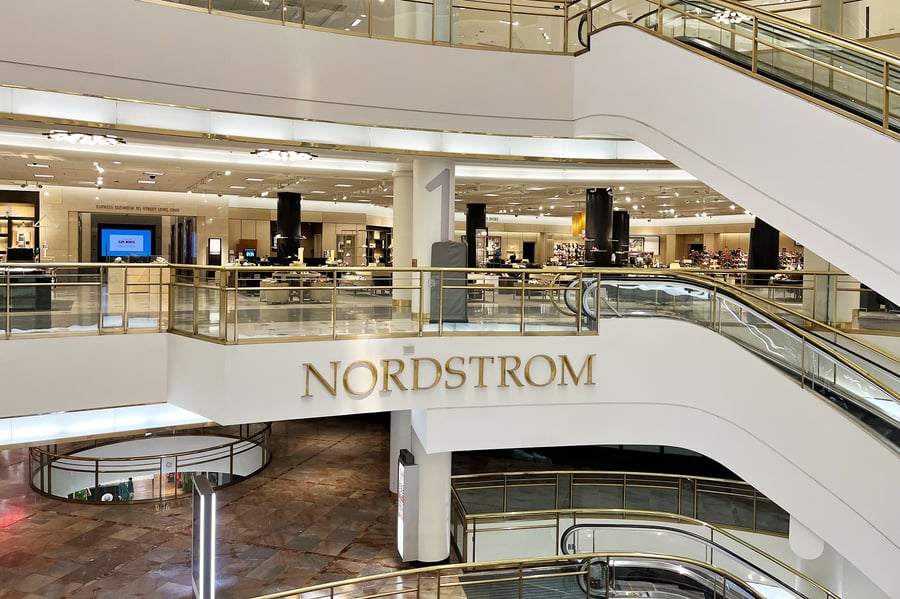
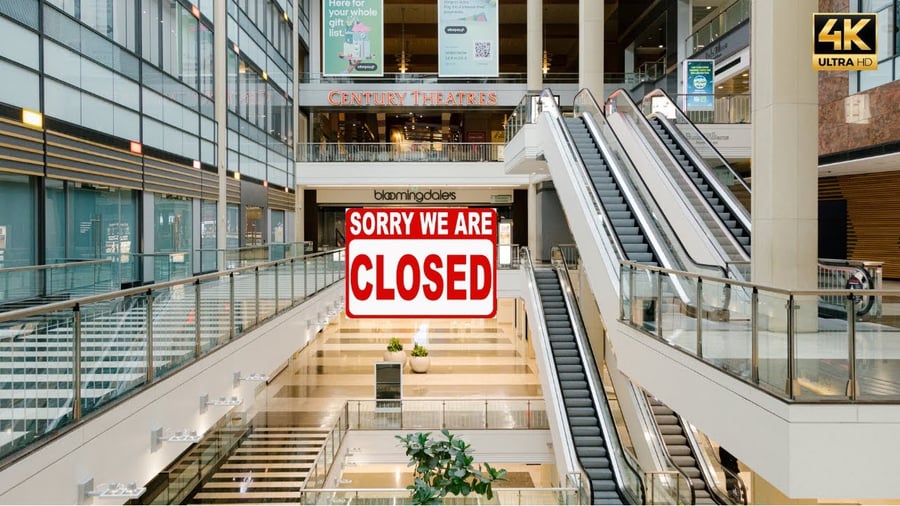
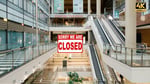
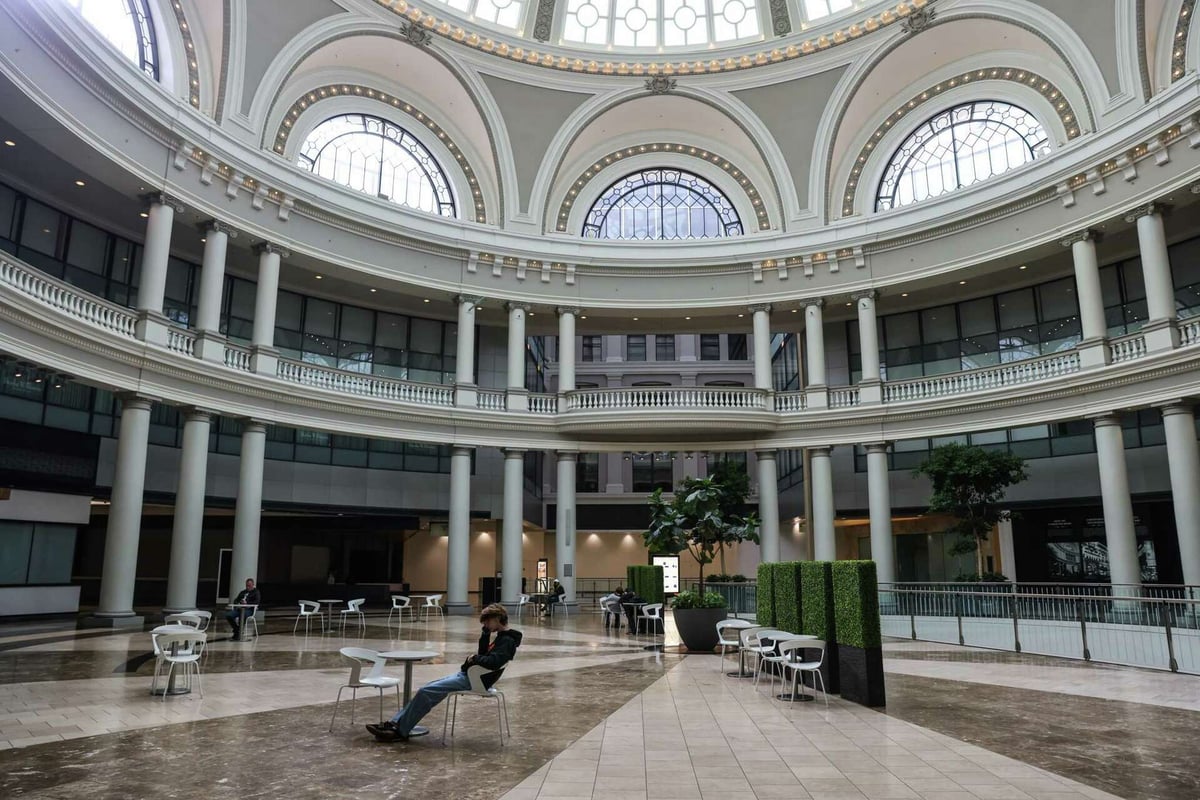
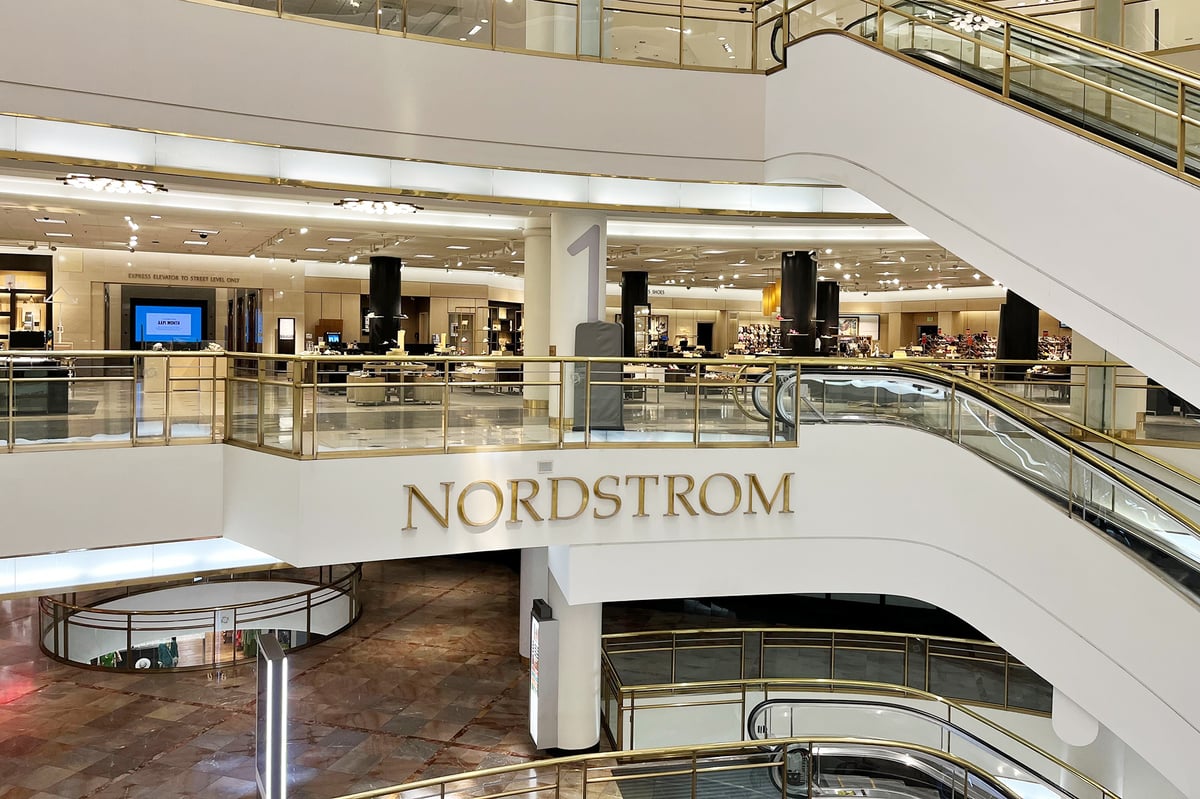
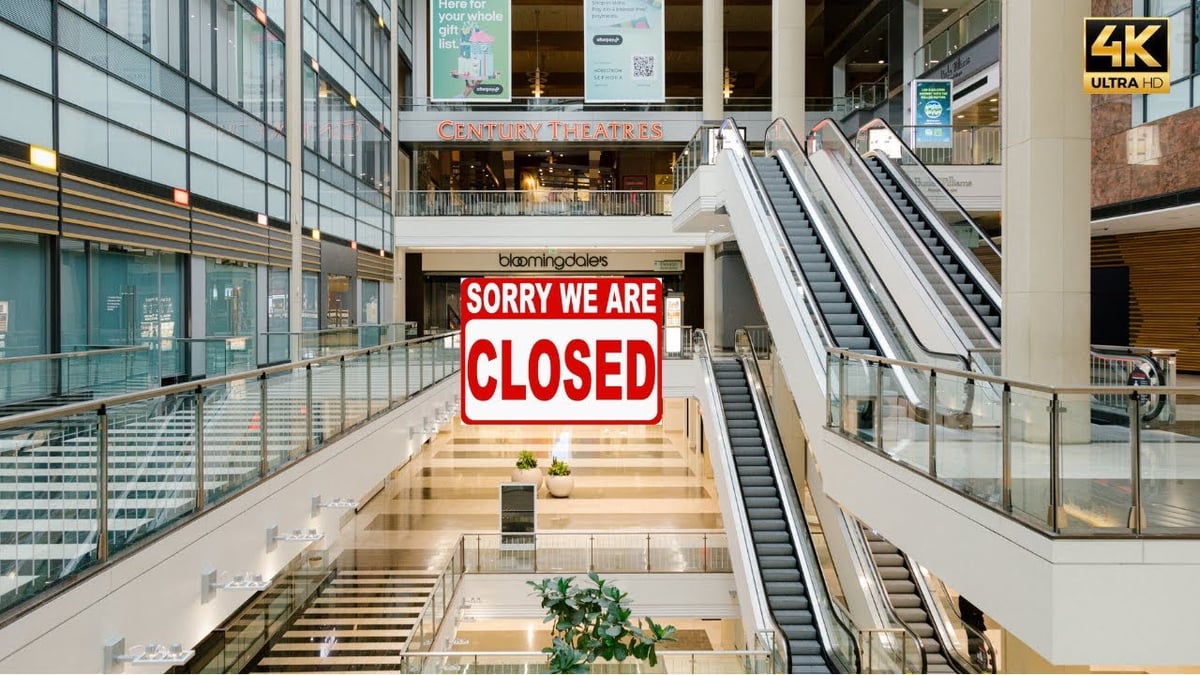
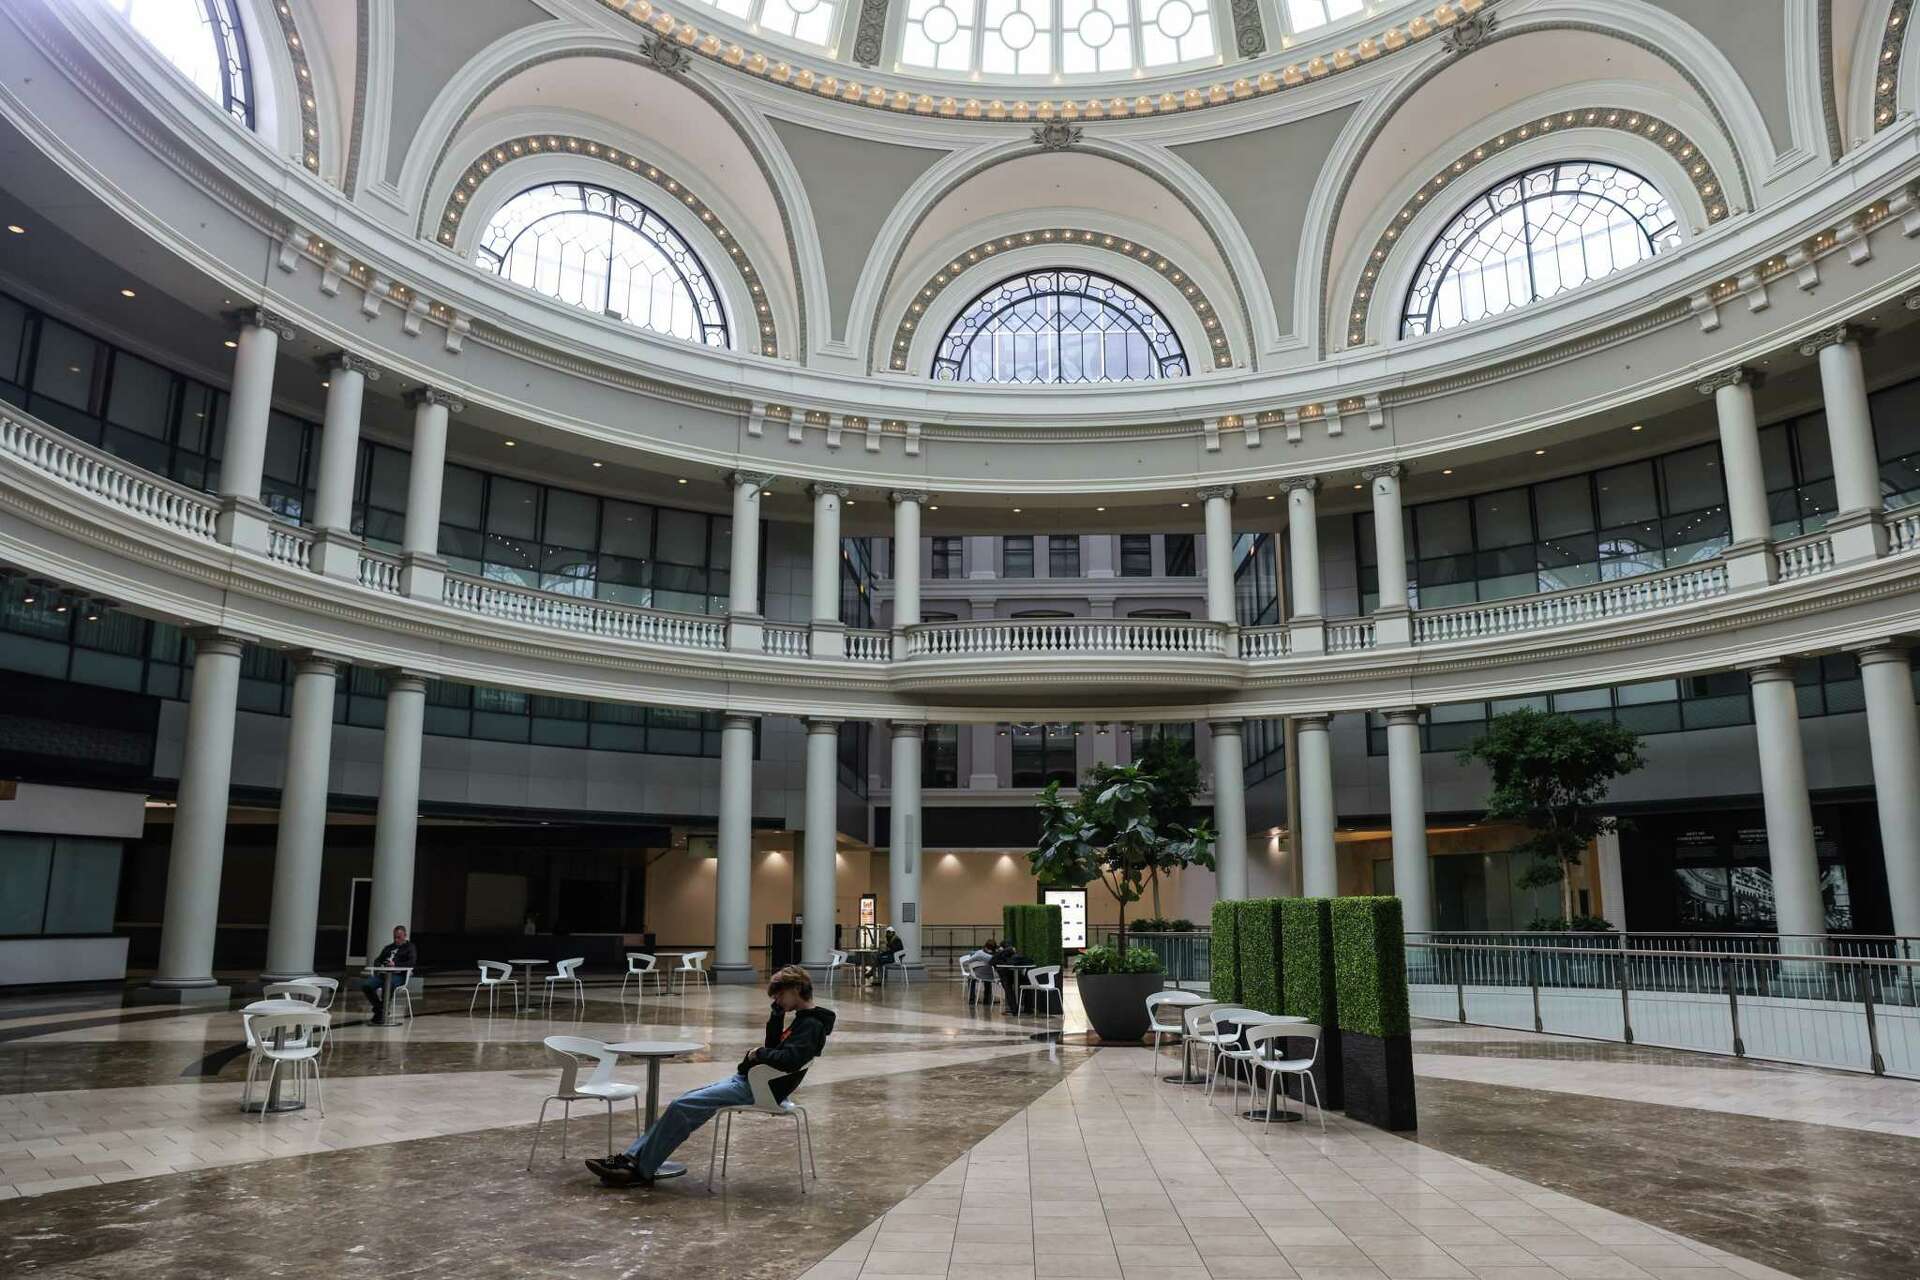
As of Q3 2025, the mall reports an occupancy rate of approximately 7%, with 93% vacancy, reflecting the exodus of major anchors like Nordstrom and Bloomingdale's in recent years. Remaining tenants include a handful of smaller retailers, food outlets, and experiential stores such as Apple Store and select luxury boutiques like Louis Vuitton, but vast sections remain empty. The surrounding Union Square area shows stabilization with overall retail vacancy at 22.7% and footfall up 3% year-over-year to 1.16 million monthly visitors, driven by tourism recovery and tech sector growth.
Median household income in San Francisco stands at $142,200, supporting premium retail potential. Leasing opportunities present low base rents, estimated at $20-50 per square foot annually due to high availability, compared to $500 per square foot on prime Union Square streets. Advantages include prime visibility to 10 million annual downtown visitors and potential for mixed-use redevelopment under new ownership announced in November 2025.
However, drawbacks encompass declining mall-specific footfall, down from 2024 levels, heightened security risks from urban crime, and competition from e-commerce and suburban centers like Stonestown Galleria.
Operational quality is impacted by aging infrastructure and financing hurdles, with property value dropping to $195 million, a 80% decline over the decade. Retail sales in the broader downtown rose 4.3% year-over-year, indicating market resilience, but the mall's isolated performance highlights saturation in enclosed formats amid remote work trends reducing weekday traffic.
Interested in this property?
Choose how you'd like to proceed
Advertise at this property?
Reach high-intent shoppers across digital screens, atria, and experiential placements.
Hours of Operation
Hours
| Monday | Closed |
| Tuesday | Closed |
| Wednesday | Closed |
| Thursday | Closed |
| Friday | Closed |
| Saturday | Closed |
| Sunday | Closed |
Hours may vary on public holidays. Check with individual stores for specific holiday schedules.
Insights
Occupancy and Footfall Metrics
Westfield San Francisco Centre maintains a critically low occupancy of 7% as of Q3 2025, with 93% of its 1.1 million square feet vacant following anchor departures. Footfall has continued to decline from 2024, contrasting with Union Square's 3% year-over-year increase to 1.16 million monthly visitors. This gap underscores the mall's struggle to attract sustained traffic despite direct BART connectivity serving 40,000 daily riders. Data from Placer.ai indicates mall visits dropped 15-20% in 2025, exacerbated by store closures and perceptions of underutilization. While broader San Francisco retail vacancy improved to 7.1%, the property's metrics signal high risk for new lessees, though low occupancy could enable flexible lease negotiations and repositioning opportunities in a recovering market.
Demographic Profile and Accessibility
The mall draws from San Francisco's affluent demographic, with median household income at $142,200 and a population of 873,000 featuring high concentrations of tech professionals aged 25-44. Union Square attracts 10 million tourists annually, boosting seasonal footfall for luxury retail. Accessibility is a strength, with seamless links to BART, Muni, and cable cars, handling 50 million transit passengers yearly. However, challenges include urban safety concerns, with crime rates 20% above national averages impacting shopper confidence. Demographic shifts toward remote work have reduced commuter traffic by 25% since 2020, per Census data, while diverse ethnic makeup (35% Asian, 15% Hispanic) supports varied tenant mixes. Overall, the profile favors experiential or tourist-oriented concepts but requires robust security to mitigate access drawbacks.
Competition and Lease Terms
Intense competition from Union Square's street retail, boasting $500 per square foot rents and new openings like Pop Mart and Bang & Olufsen, diverts premium traffic from the enclosed mall. Suburban rivals like Stonestown Galleria report 90% occupancy and stable footfall, appealing to families avoiding downtown issues. Market saturation in apparel categories, with 4.3% sales growth but e-commerce capturing 25% of retail spend, pressures enclosed centers. Lease terms offer advantages with base rents at $20-50 per square foot, far below street levels, and potential concessions like rent abatements amid high vacancy. Risks include percentage rent clauses tied to low sales and operational costs from aging infrastructure, estimated at 15-20% of revenue. Cushman & Wakefield notes increased investment activity, with $58.6 million in Q3 2025 deals, suggesting revitalization potential but requiring tenants to navigate financing uncertainties under new ownership.
Building Details
Detailed Market Analytics
City Snapshot
San Francisco, CA
Comprehensive market intelligence for retail expansion in this city

Other Retail Destinations in San Francisco
Discover more shopping centers in San Francisco.
Popular in United States
Top retail destinations across United States.

.jpeg)


Interested in this property?
Choose how you'd like to proceed
Advertise at this property?
Reach high-intent shoppers across digital screens, atria, and experiential placements.
City Snapshot
San Francisco, CA
Comprehensive market intelligence for retail expansion in this city