


Brand Fit Snapshot
Best for:
Not ideal if:
Similar properties you might like:
Quick assessment - takes 30 seconds
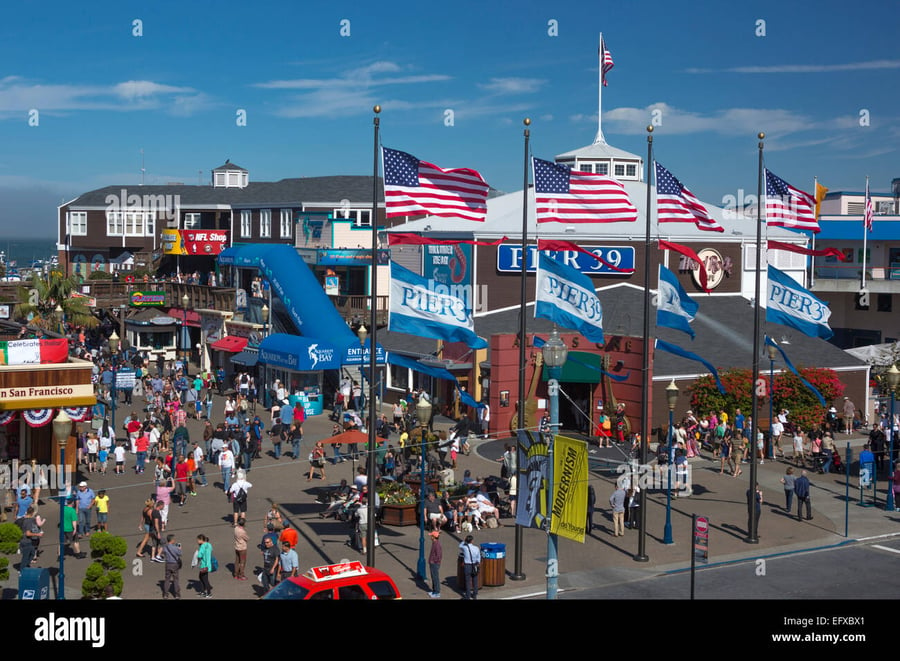
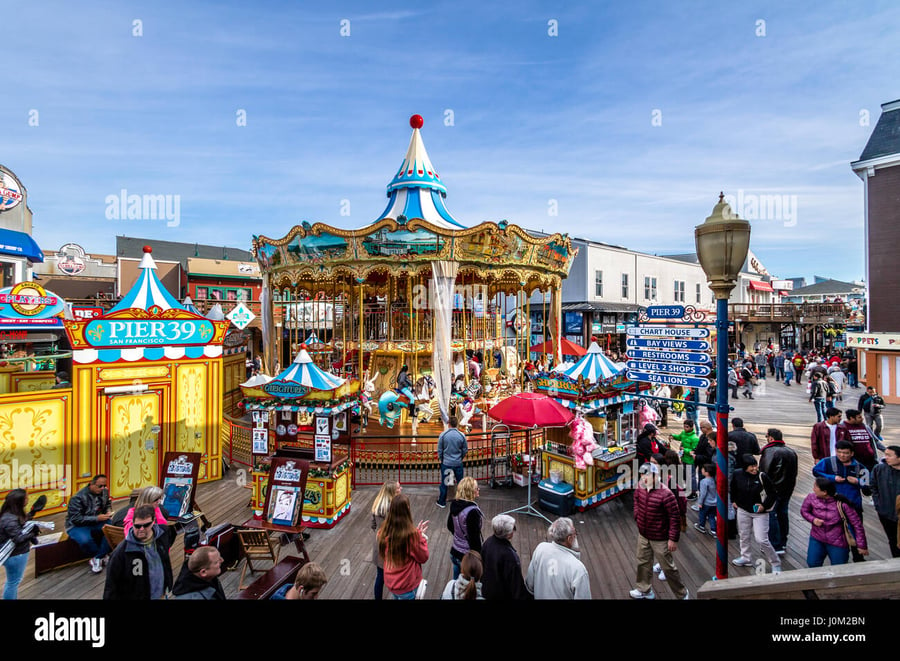
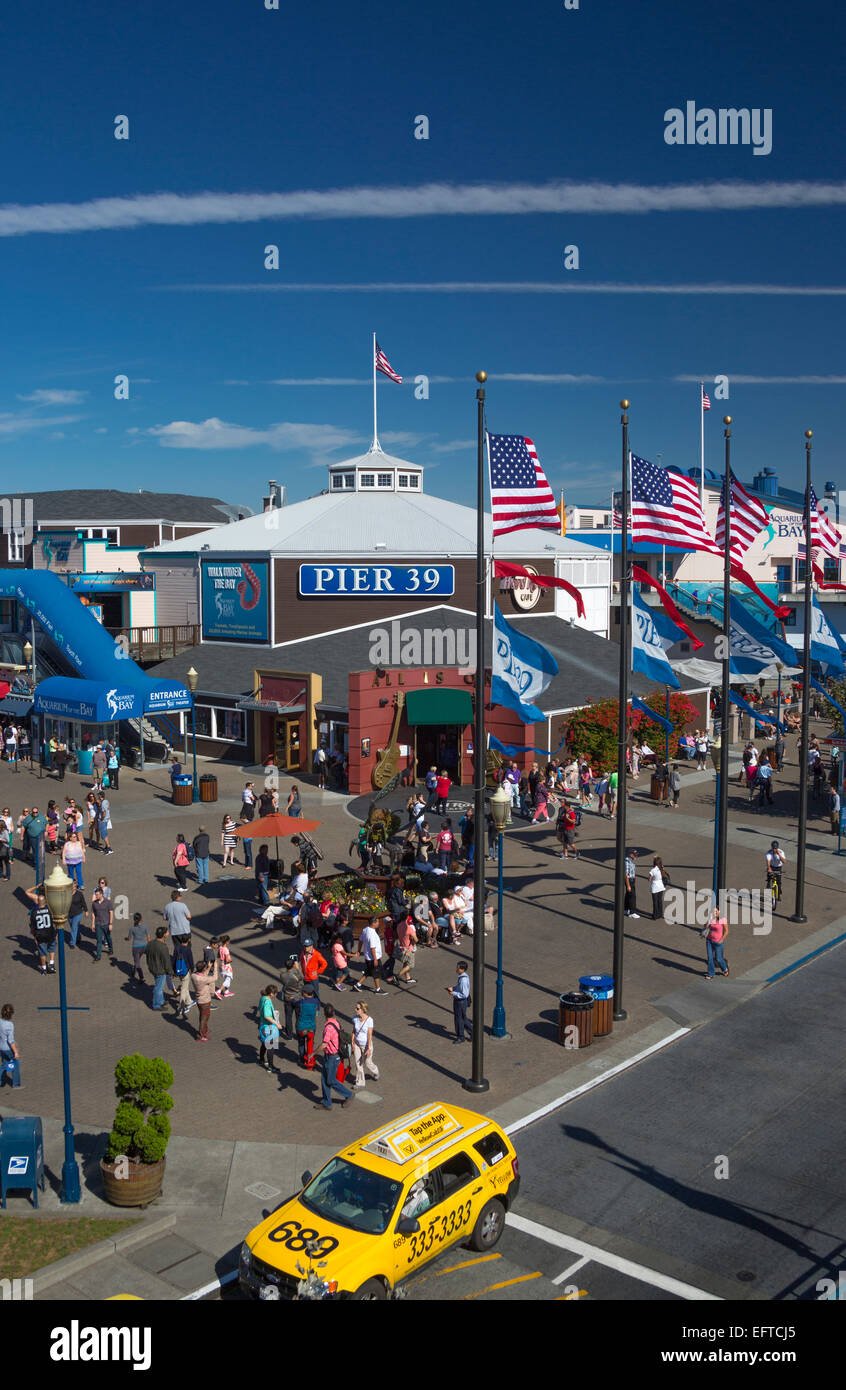
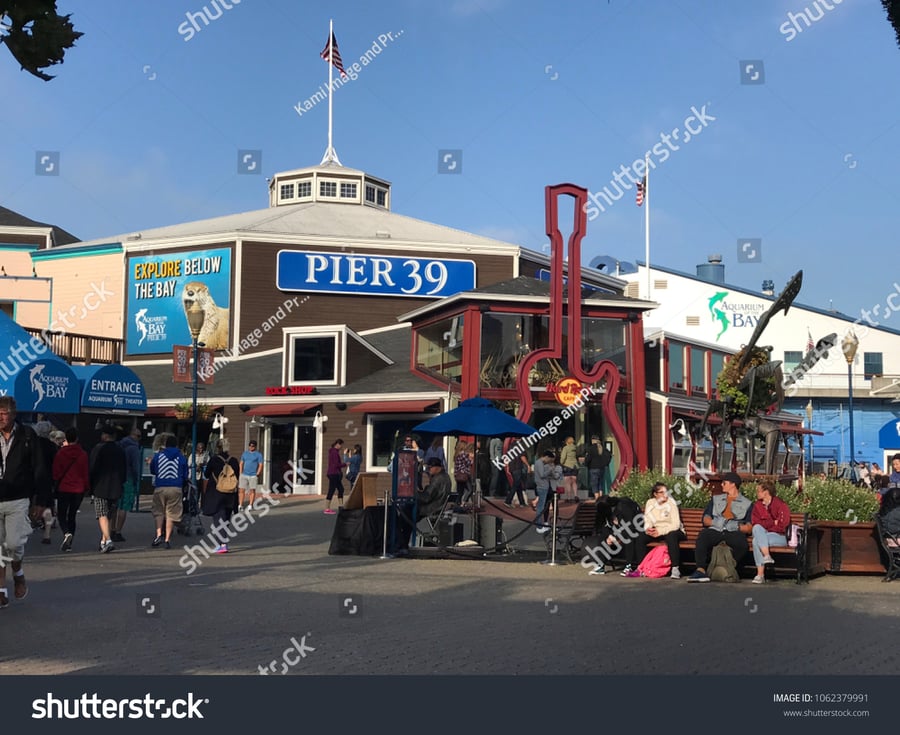
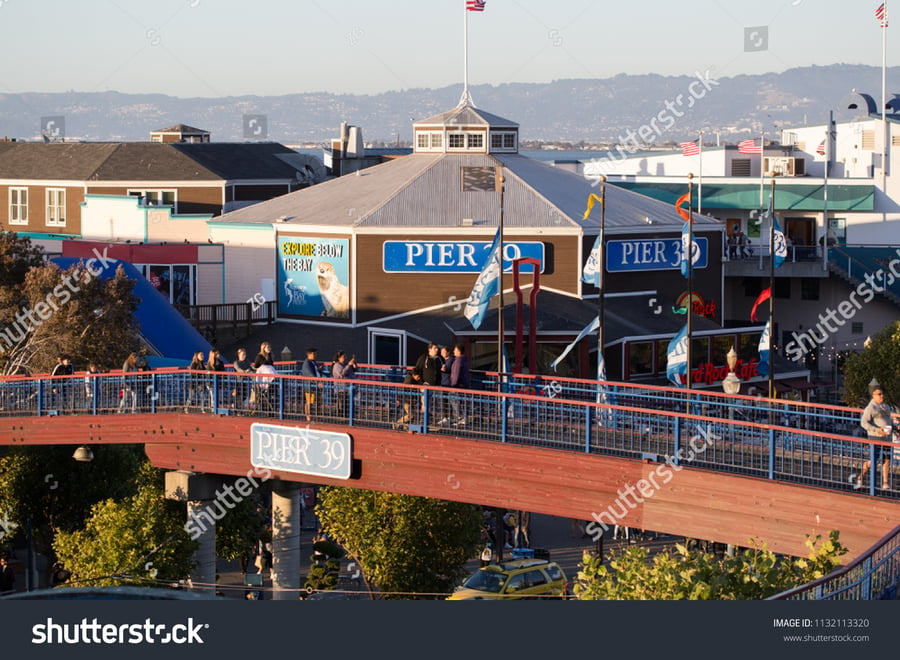
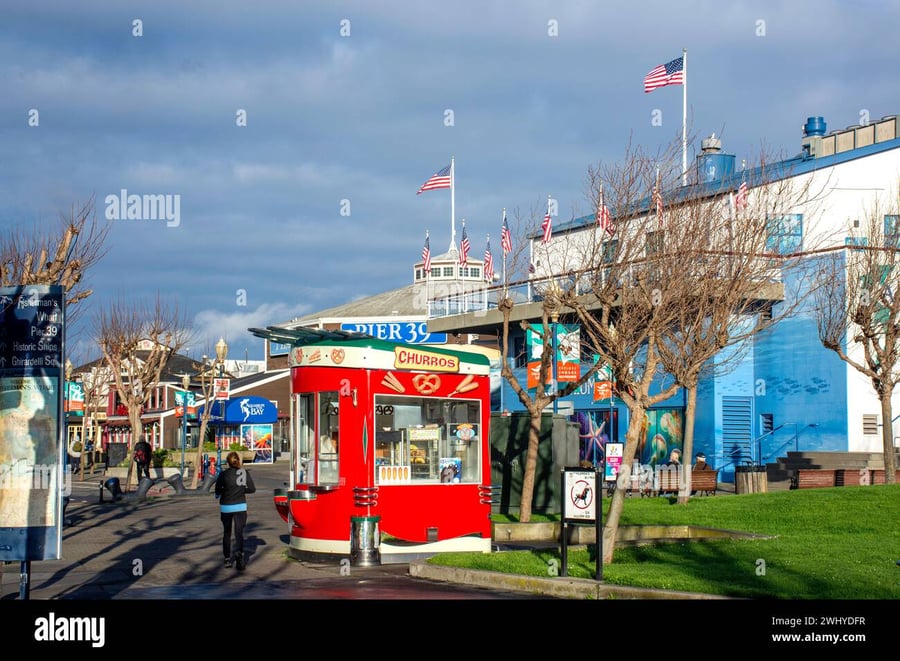
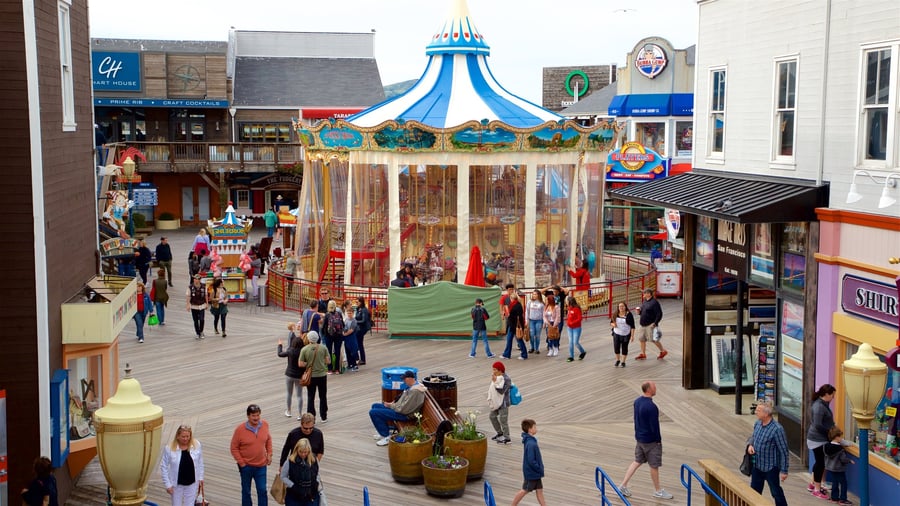
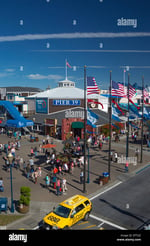
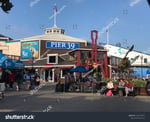
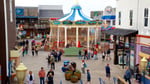
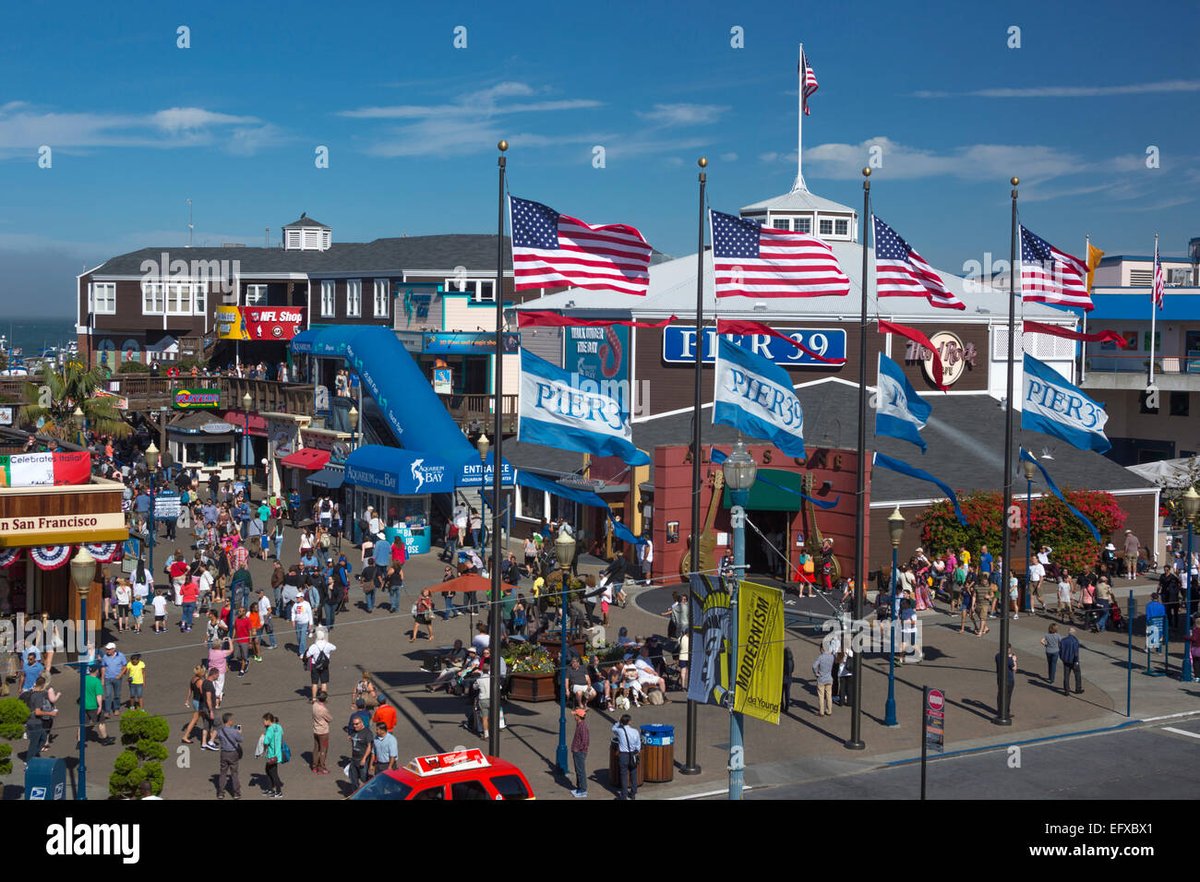
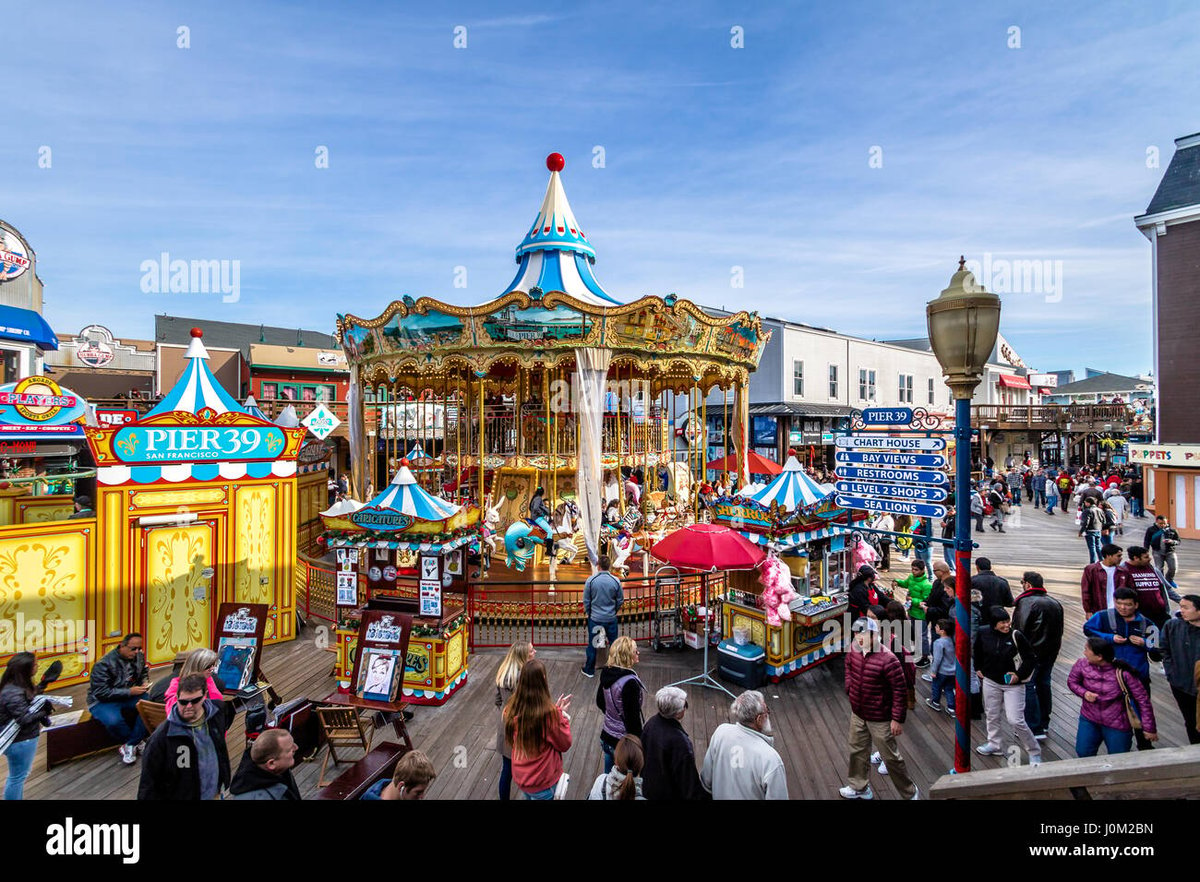
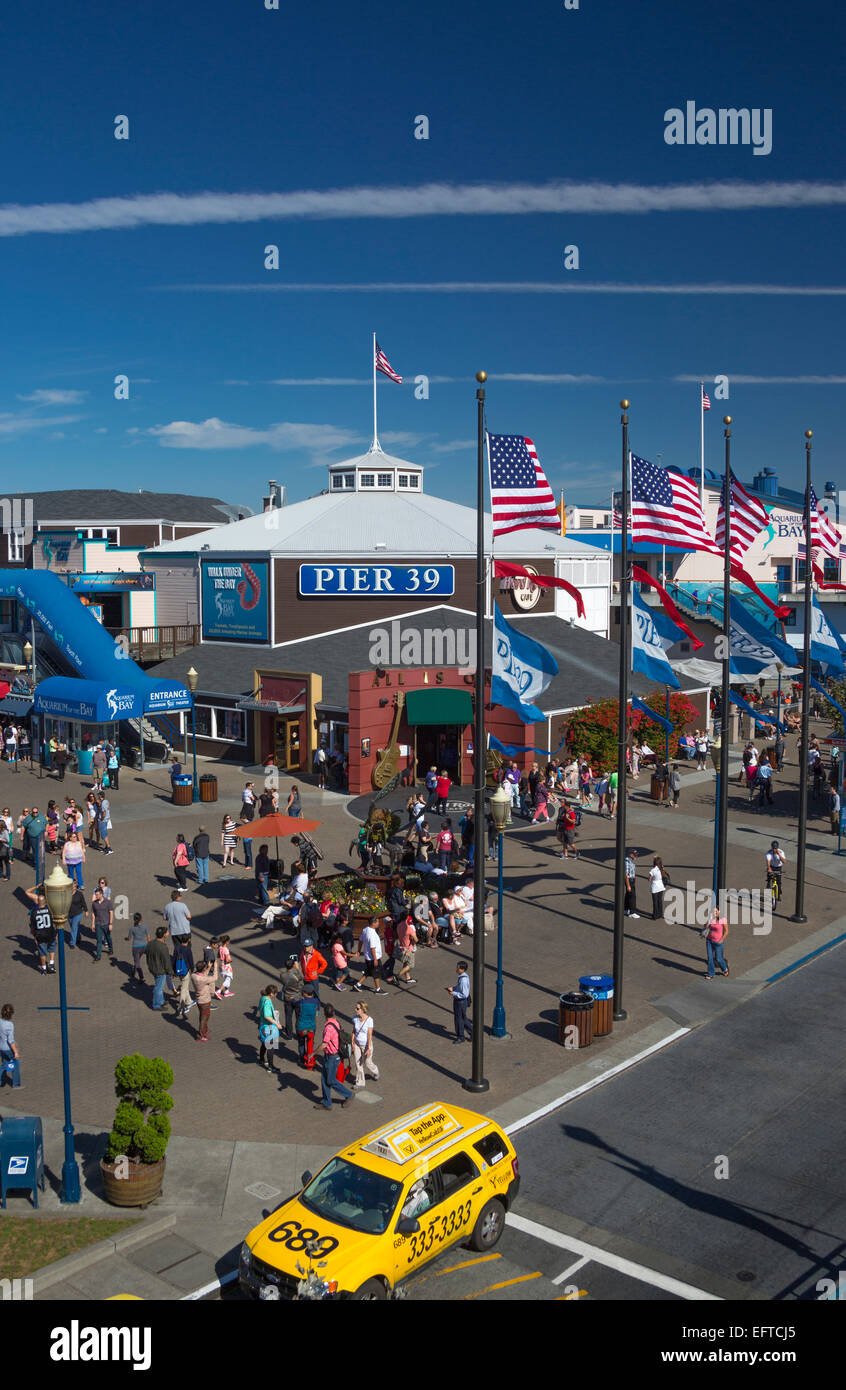
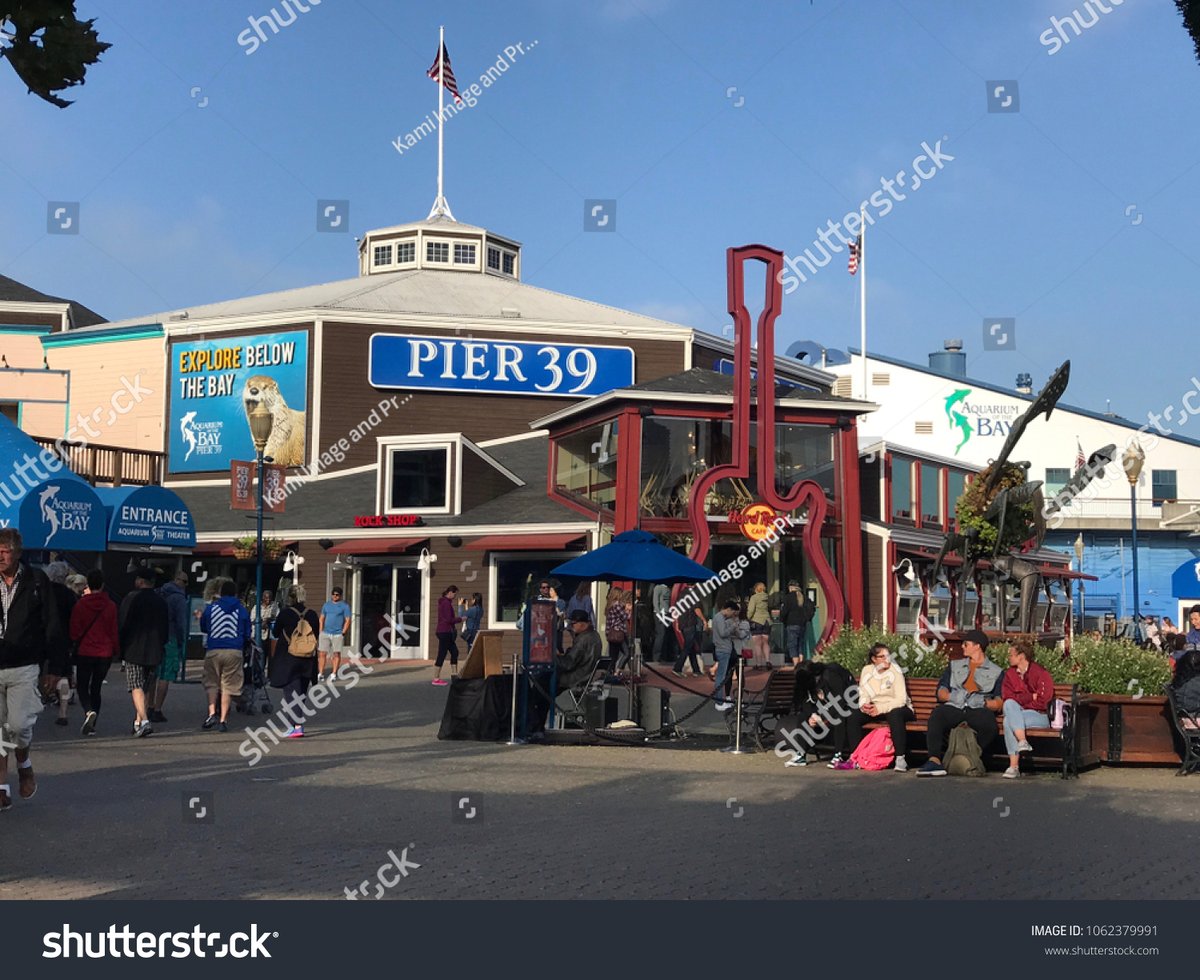
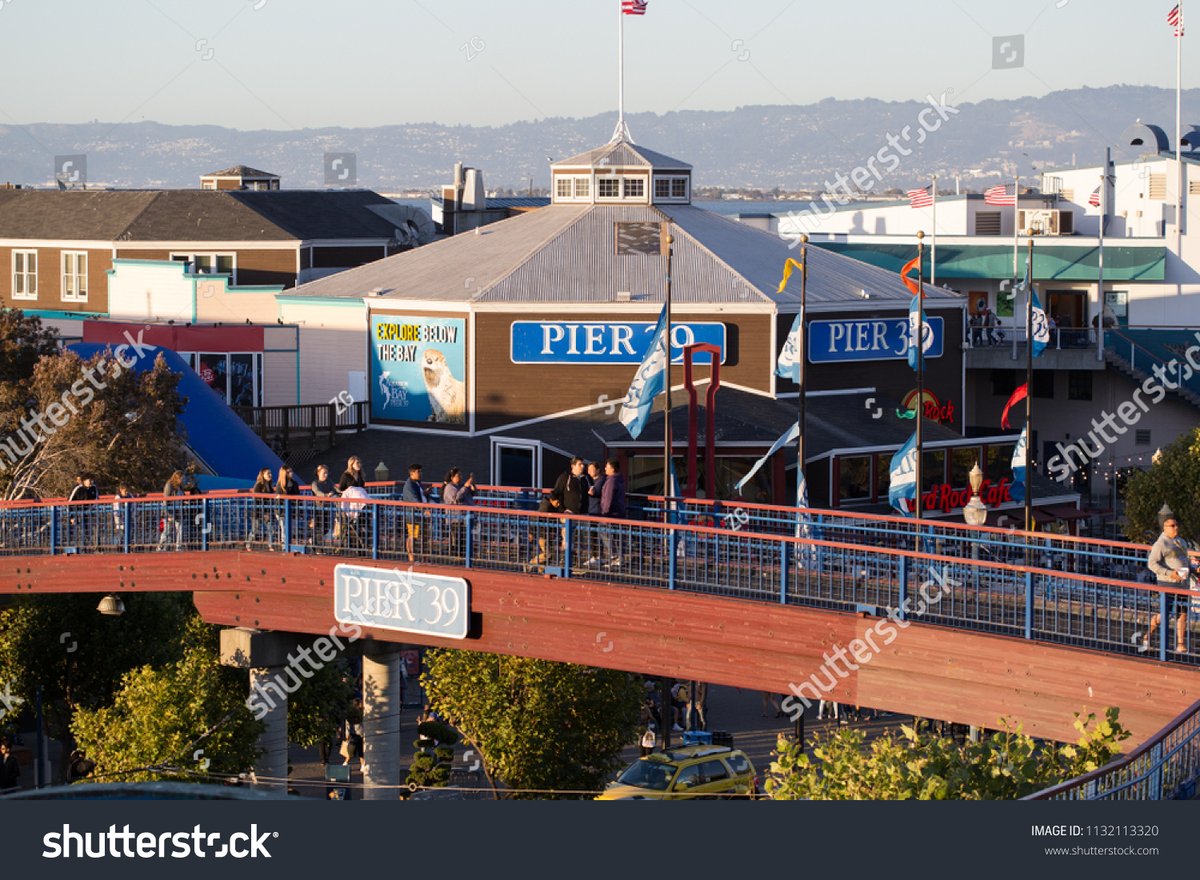
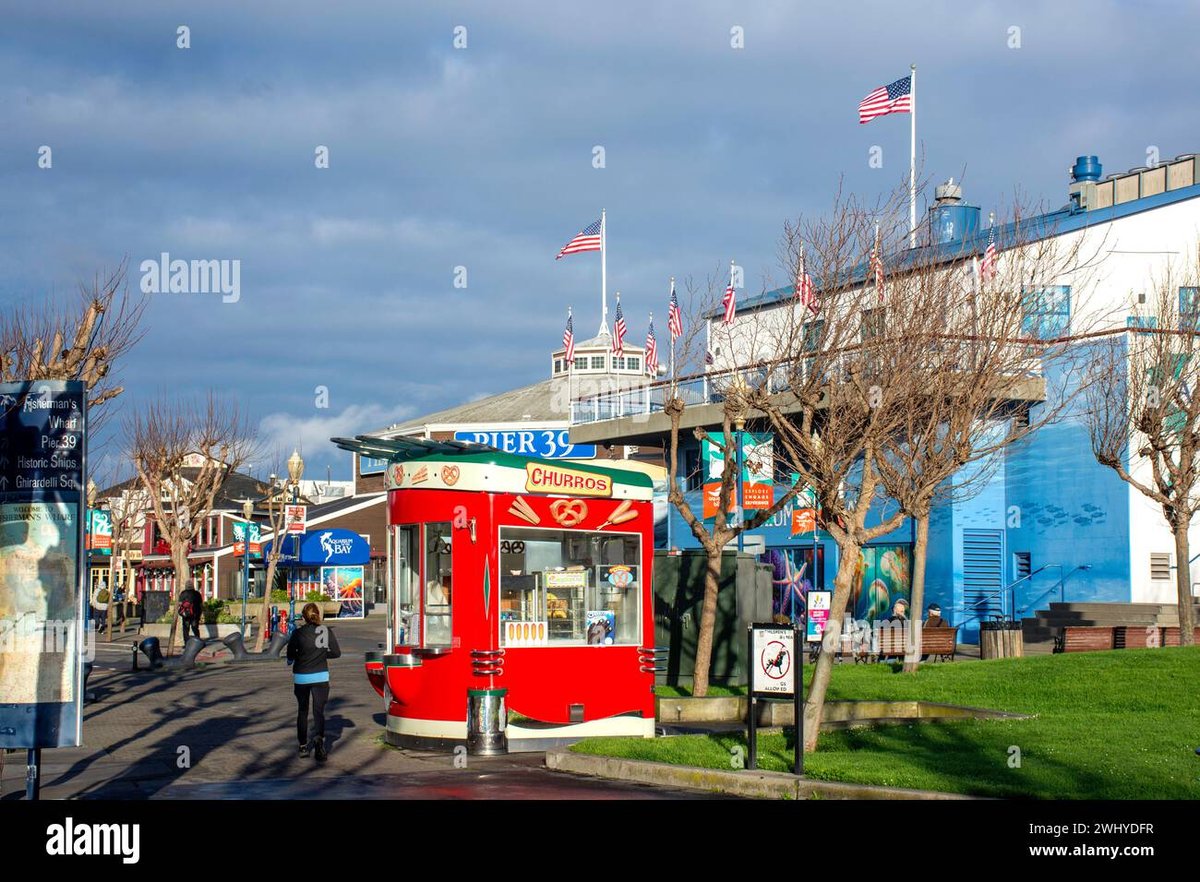
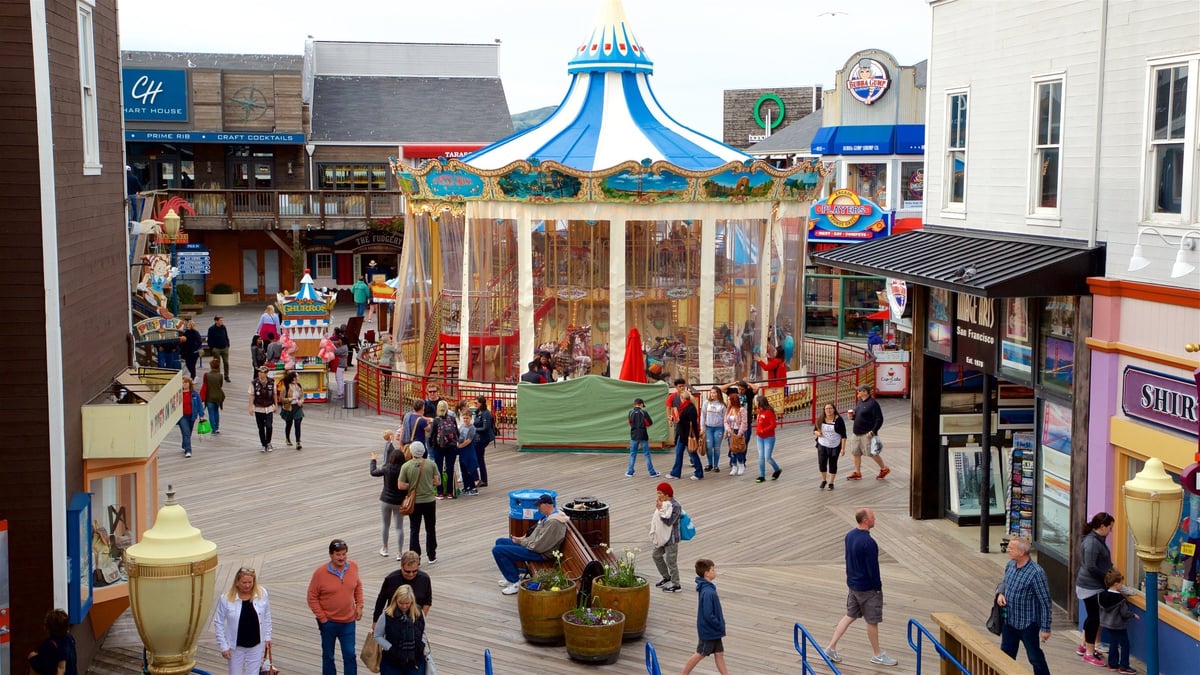
Pier 39 is a key waterfront retail and entertainment destination in San Francisco's Fisherman's Wharf area, spanning 45 acres and drawing around 10 million visitors annually as one of the top U.S. tourist sites, per tourism data and Statista rankings. Established in 1978, it features over 90 tenants focused on experiential offerings, including specialty retail like souvenirs, apparel, and jewelry; diverse dining from fast-casual to upscale seafood restaurants; and attractions such as the Aquarium of the Bay and the iconic California sea lions.
The tenant mix supports high dwell time through complementary categories that cater to tourists, with recent floor plans indicating available spaces for innovative concepts like unique food kiosks and pop-ups. In the broader San Francisco retail market, which reported a 7.1% vacancy rate in Q3 2025 per Cushman & Wakefield, Pier 39 holds a strong position due to tourism recovery, with Bay Area fundamentals showing transaction momentum and tenant expansion as noted in 2025 market reports.
Leasing advantages include exceptional visibility and footfall from its Embarcadero location, proximity to cable cars and ferries enhancing accessibility, and a demographic profile of affluent domestic and international visitors (e.g., families from Europe and Asia) who spend heavily on discretionary items.
Operational quality is maintained through daily live entertainment, extended hours (10am-9pm for retail), and digital features like sea lion webcams. However, drawbacks involve seasonal fluctuations in visitor numbers, with peaks in summer and dips in winter; competition from nearby developments like Fisherman's Wharf Forward project; and potential infrastructure challenges from aging piers, as outlined in the Port of San Francisco's 10-Year Capital Plan requiring renewal investments.
Rent levels in tourist zones remain stable at approximately $50-80 per square foot, flat year-over-year amid modest market growth of -1.5%, offering balanced terms for high-traffic exposure but with risks from economic sensitivity in tourism-dependent retail.
Interested in this property?
Choose how you'd like to proceed
Advertise at this property?
Reach high-intent shoppers across digital screens, atria, and experiential placements.
Hours of Operation
Hours
| Monday | 10:00 AM — 08:00 PM |
| Tuesday | 10:00 AM — 08:00 PM |
| Wednesday | 10:00 AM — 08:00 PM |
| Thursday | 10:00 AM — 08:00 PM |
| Friday | 10:00 AM — 08:00 PM |
| Saturday | 10:00 AM — 08:00 PM |
| Sunday | 10:00 AM — 08:00 PM |
Hours may vary on public holidays. Check with individual stores for specific holiday schedules.
Insights
Footfall and Demographic Profile
Pier 39 generates significant footfall of approximately 10 million visitors per year, positioning it among San Francisco's most visited attractions alongside Golden Gate Park, according to Statista and tourism metrics. The demographic profile primarily consists of tourists, including families, couples, and groups from domestic urban areas and international markets like Europe, Asia, and Canada, with median household incomes above the national average due to the affluent Bay Area draw. This supports robust sales for experiential and souvenir retail, with average visitor spending on merchandise and dining estimated at $20-50 per person based on industry benchmarks. Strengths include consistent traffic from its status as a tourism gateway, but risks arise from seasonality, where winter months see 30-50% drops, and external factors like economic downturns affecting travel, as seen in post-pandemic recovery patterns through 2025.
Tenant Mix and Occupancy Rates
The tenant mix at Pier 39 comprises over 50 retail units, 20 restaurants, and various kiosks and attractions, fostering a vibrant ecosystem that encourages cross-shopping and extended visits. Occupancy remains high, near 95%, outperforming the San Francisco retail average of 92.9% in Q3 2025 per Cushman & Wakefield reports, due to its appeal for tourist-oriented brands like Sunglass Hut and specialty food vendors. Key strengths lie in the balance of categories that avoid oversaturation in any single area, promoting synergy with entertainment elements like street performers. Drawbacks include potential weakness in non-tourist categories, such as everyday apparel, amid market saturation for souvenirs, and operational dependencies on seasonal staffing adjustments. Overall, the mix enhances leasing viability for complementary entrants but requires differentiation to compete internally.
Rent Levels, Competition, and Infrastructure Risks
Retail rents at Pier 39 range from $50 to $80 per square foot on a base year structure, aligning with flat growth in San Francisco's tourist corridors as reported in Q3 2025 market overviews, where overall rents declined -1.5% annually amid stabilizing vacancy. Competition is intense from adjacent Fisherman's Wharf sites undergoing redevelopment, such as the 2025 Fisherman's Wharf Forward initiative, and broader alternatives like Ghirardelli Square or downtown Union Square, which capture similar visitor segments and contribute to category saturation in dining and gifts. Accessibility benefits from Muni transit and ferry links but faces challenges with limited parking (about 1,000 spaces) and Embarcadero traffic congestion. Aging infrastructure represents a risk, with the Port of San Francisco's capital plan highlighting needs for pier maintenance and seismic upgrades, potentially leading to disruptions or higher operating costs for tenants, though high footfall mitigates some market pressures.
Building Details
Detailed Market Analytics
City Snapshot
San Francisco, CA
Comprehensive market intelligence for retail expansion in this city

Other Retail Destinations in San Francisco
Discover more shopping centers in San Francisco.
Popular in United States
Top retail destinations across United States.

.jpeg)


Interested in this property?
Choose how you'd like to proceed
Advertise at this property?
Reach high-intent shoppers across digital screens, atria, and experiential placements.
City Snapshot
San Francisco, CA
Comprehensive market intelligence for retail expansion in this city