








Brand Fit Snapshot
Best for:
Not ideal if:
Similar properties you might like:
Quick assessment - takes 30 seconds
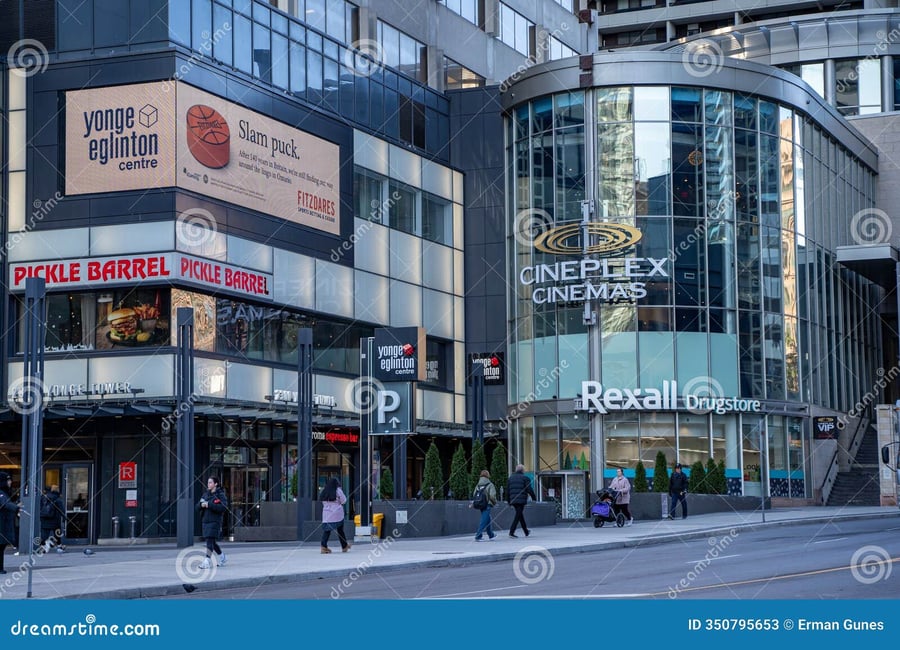
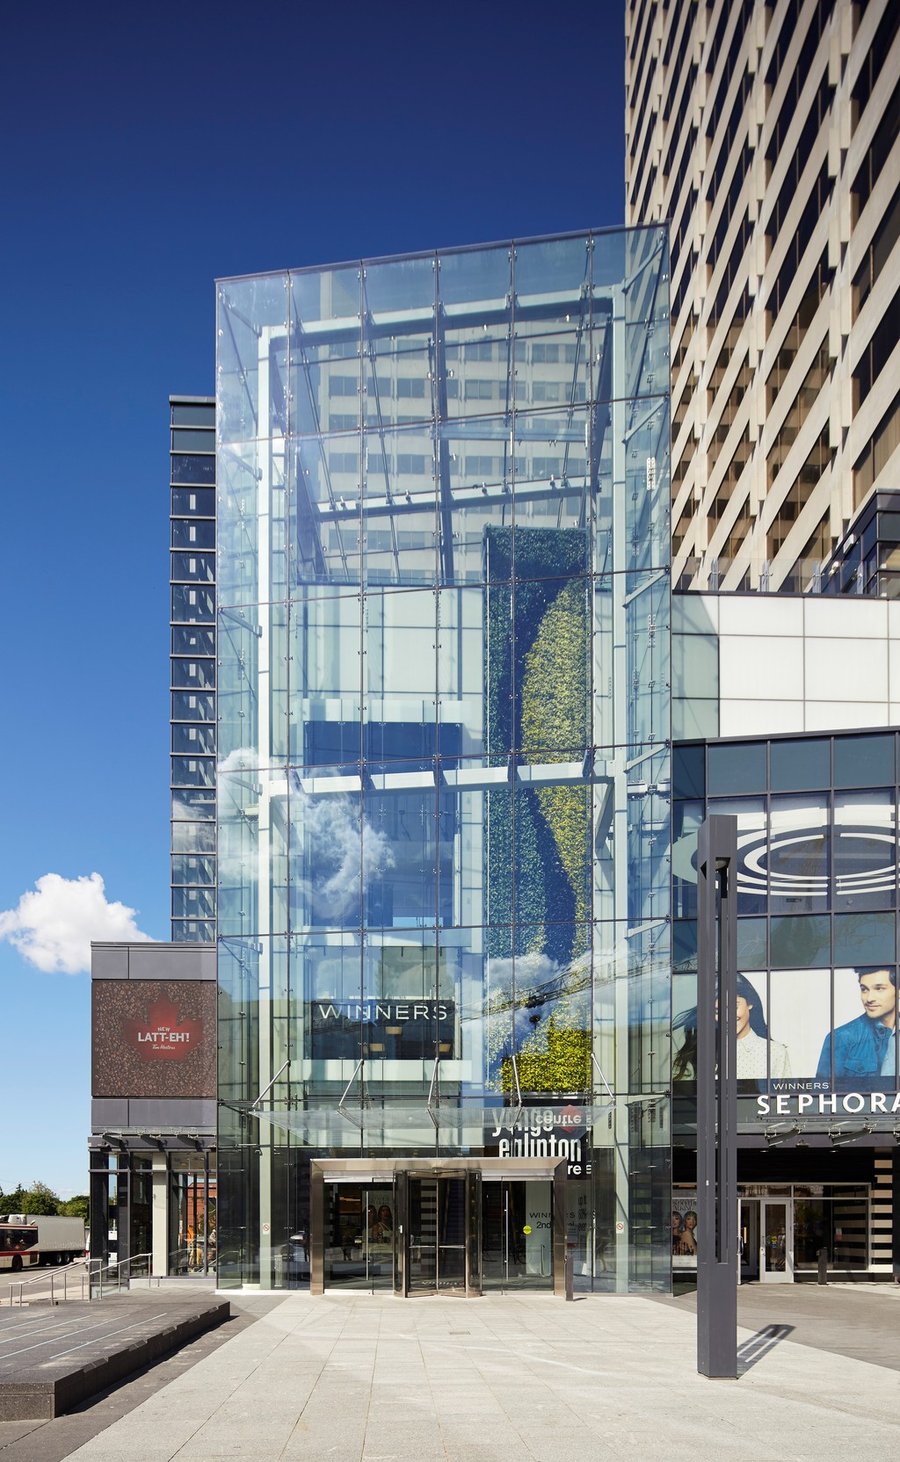
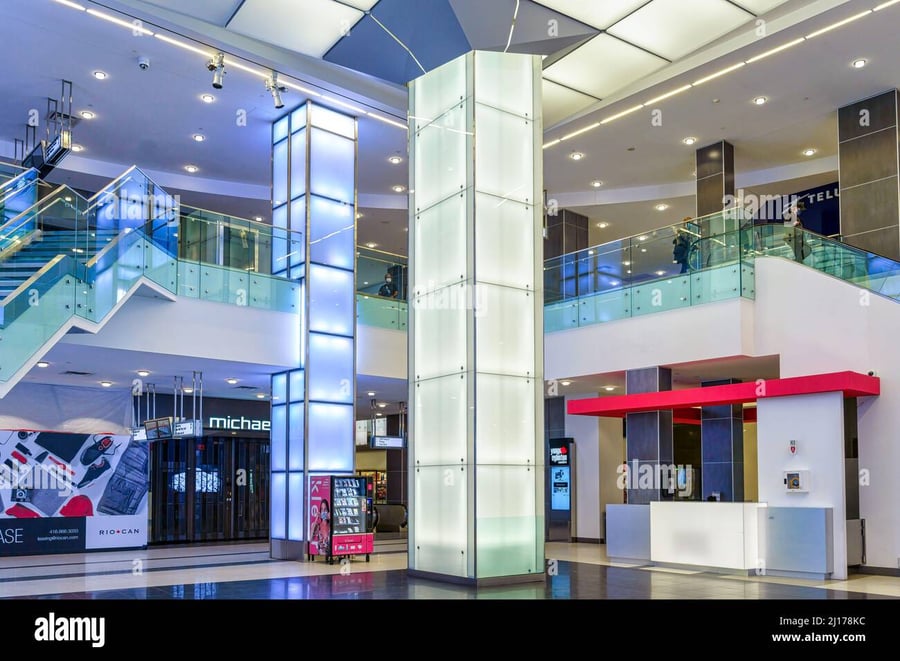
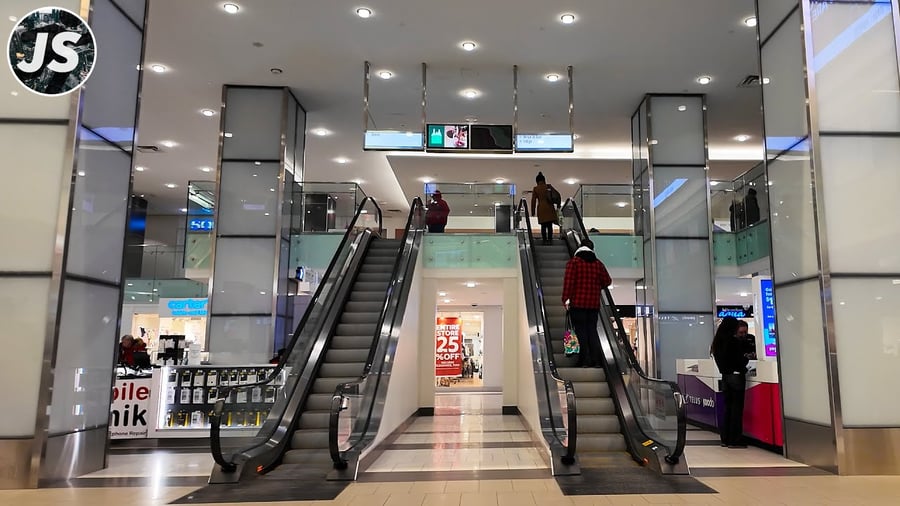
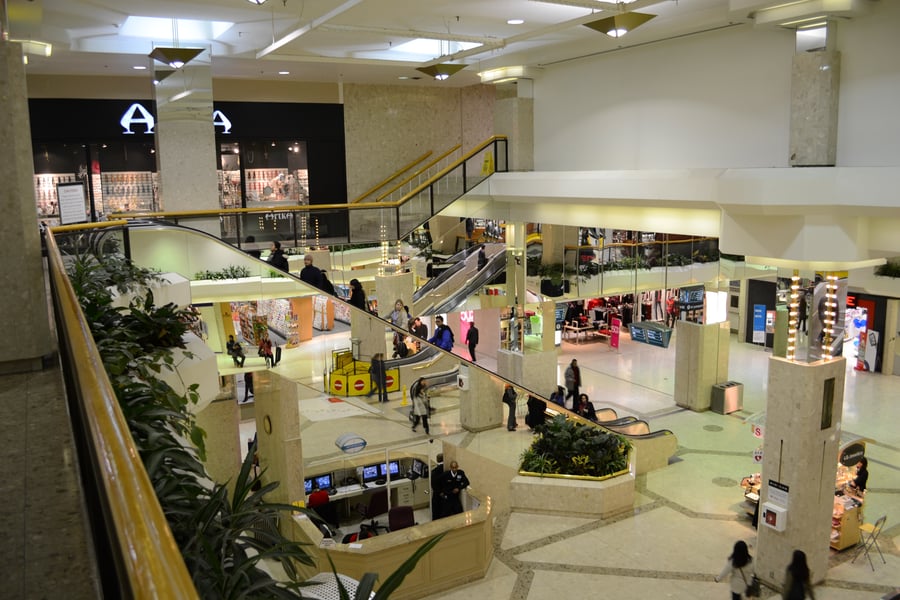
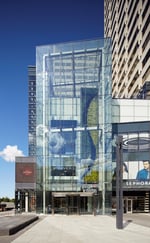
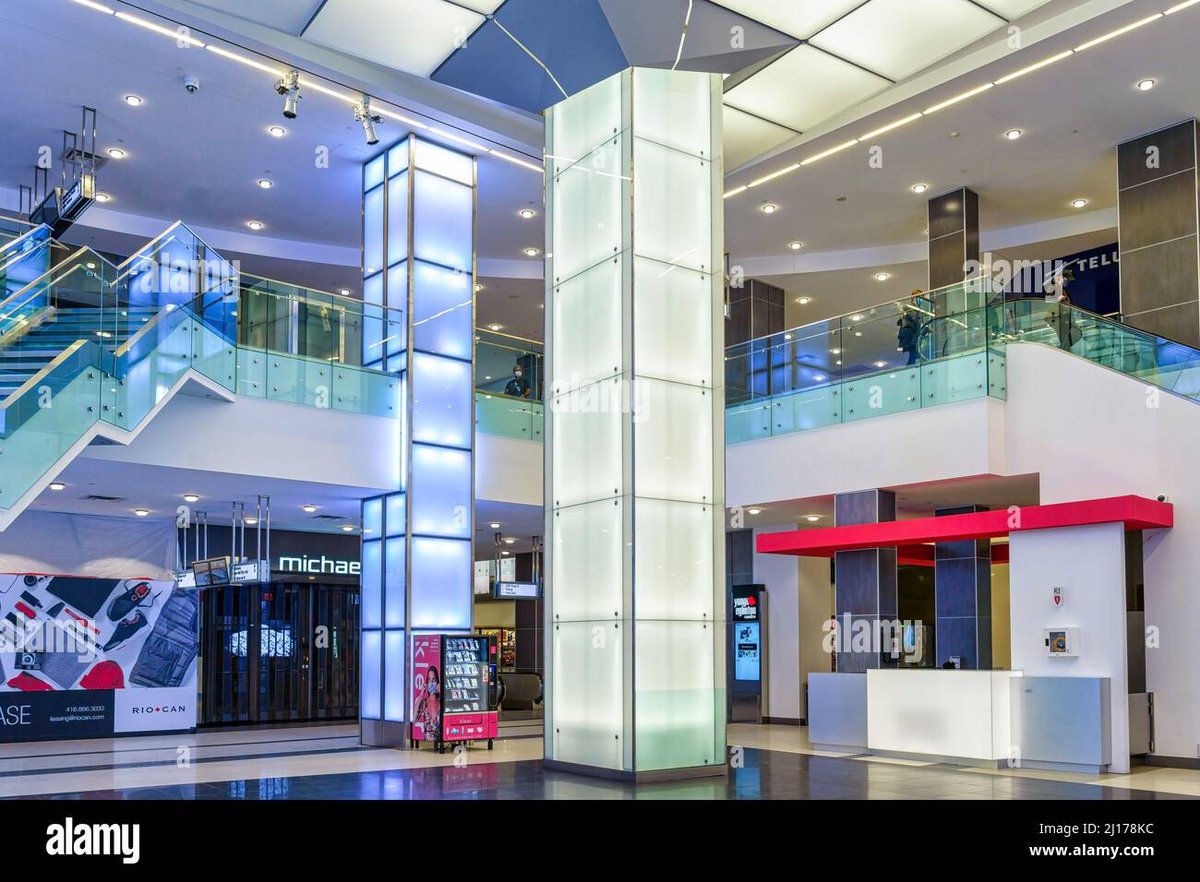
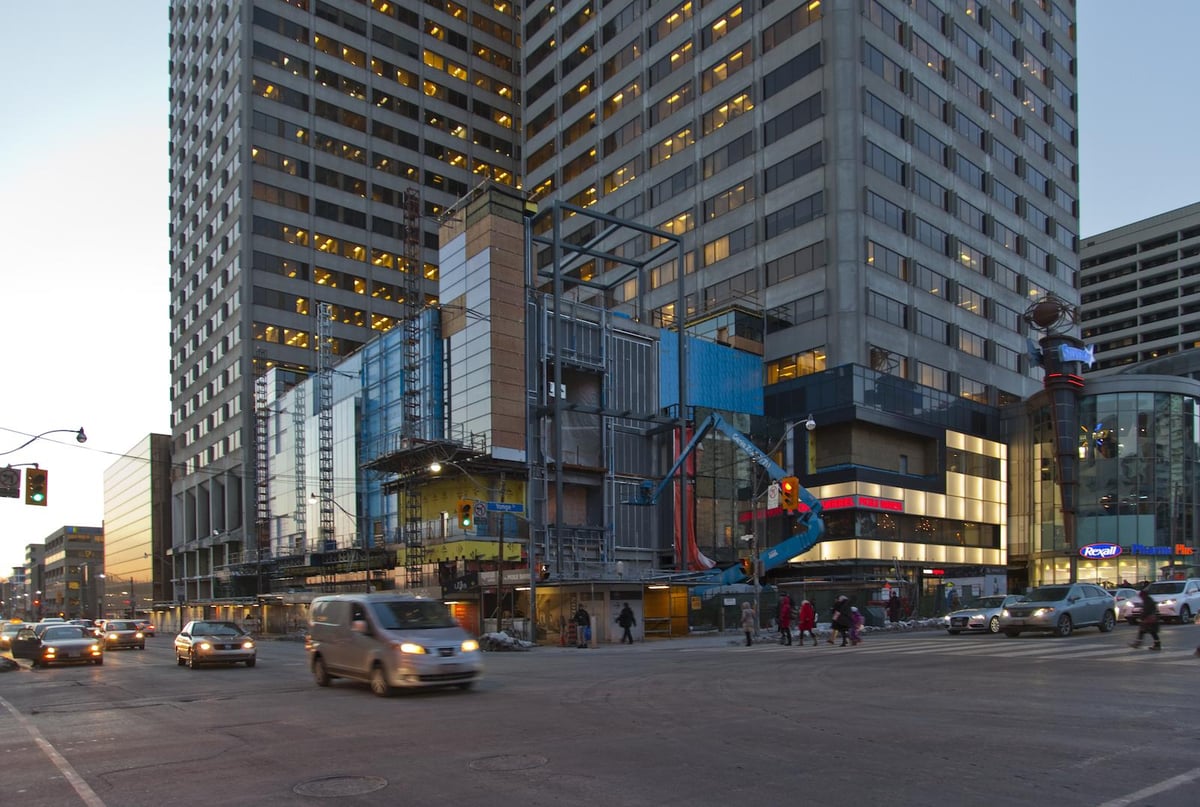
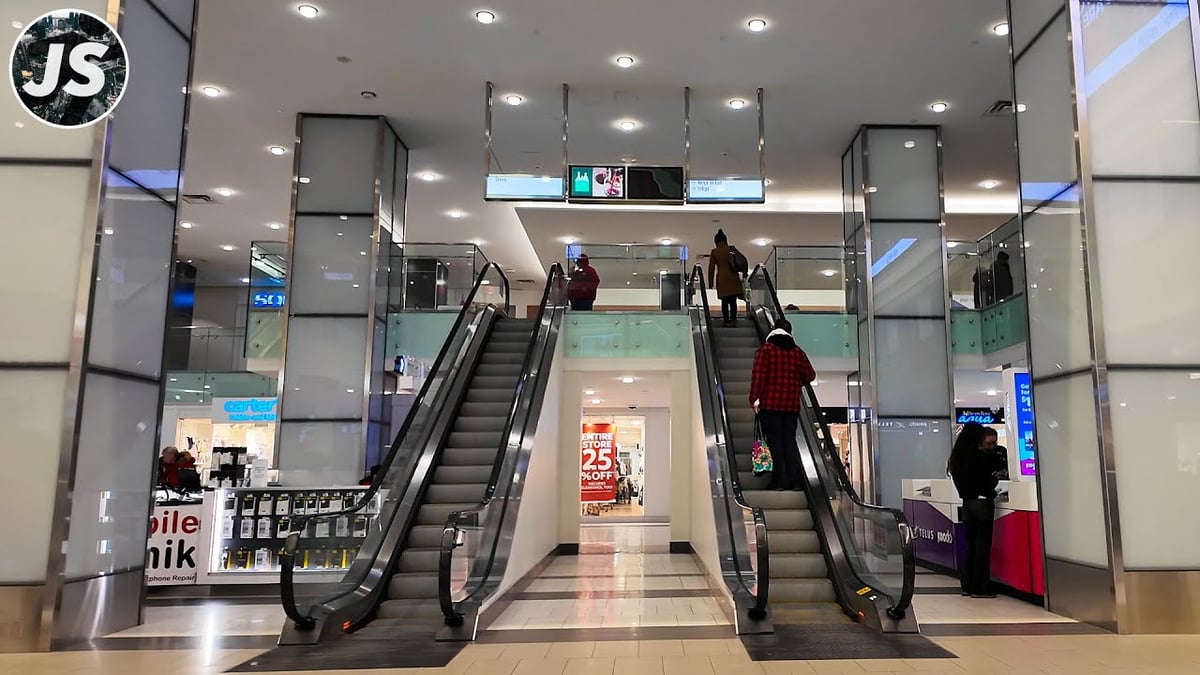
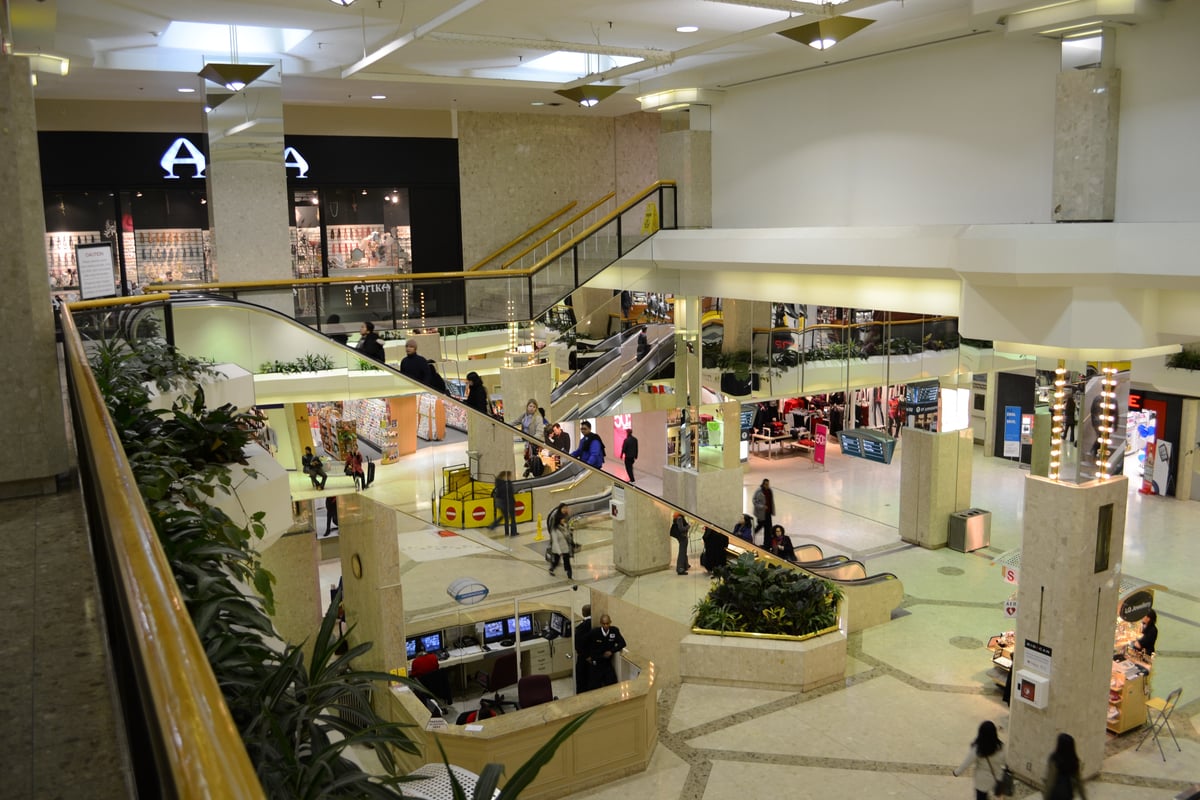
Yonge Eglinton Centre is a prominent mixed-use complex in midtown Toronto at the intersection of Yonge Street and Eglinton Avenue, encompassing approximately 1,059,136 square feet of retail space across 210 units, integrated with office towers and residential components totaling over 1,000 units. Owned by RioCan REIT, the property benefits from its position as a key transit hub with direct underground access to Eglinton Station on TTC Line 1, facilitating high pedestrian volumes estimated as the second-highest in the city.
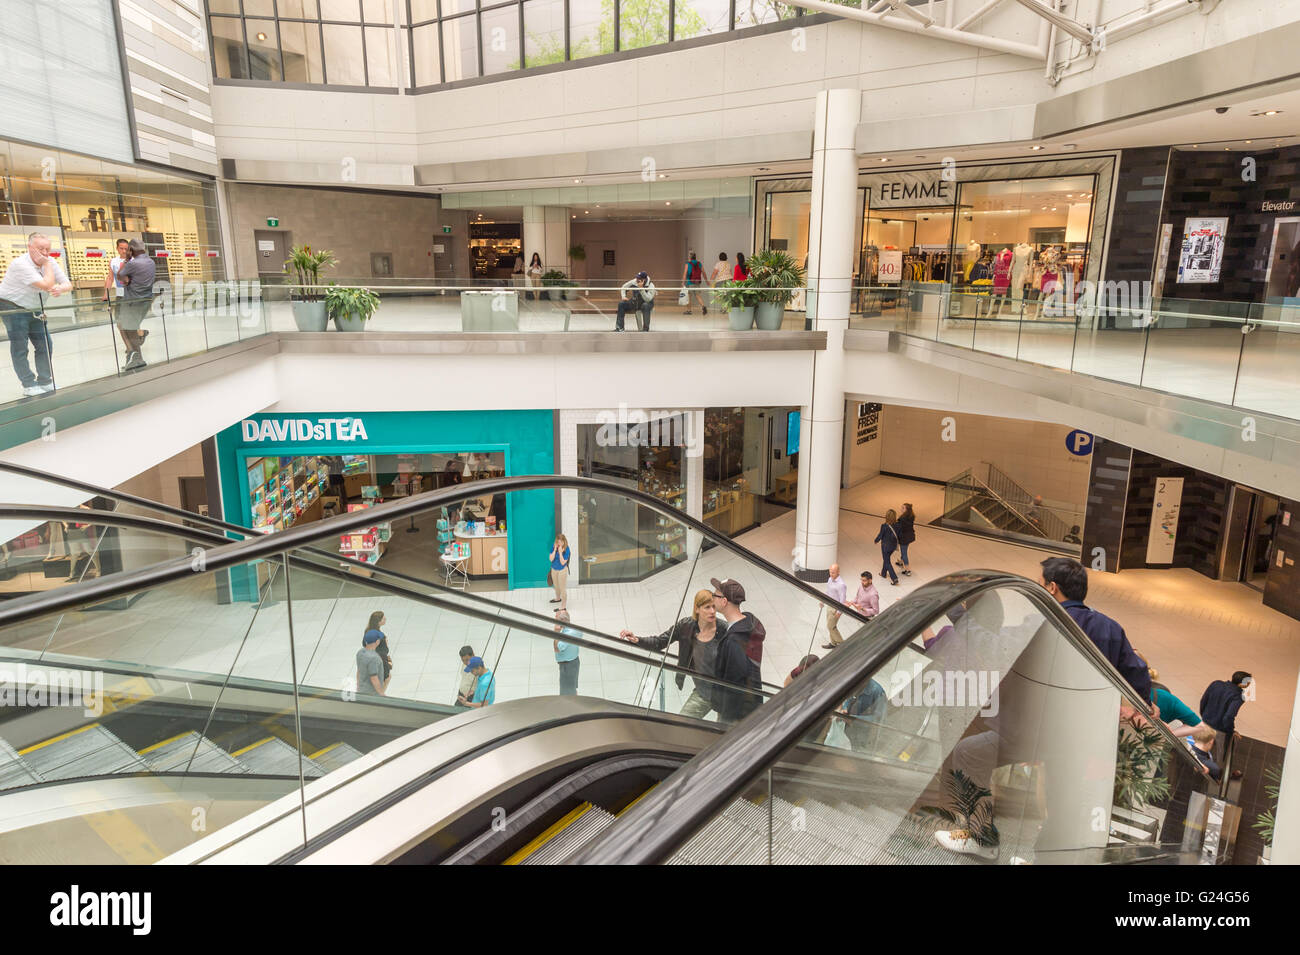
The tenant mix features strong anchors including Loblaws supermarket, Cineplex Odeon theatre, Indigo Books, Sephora, Winners, and GoodLife Fitness, complemented by diverse categories such as dining, services, and financial institutions like a recent 40,000 square foot Royal Bank of Canada lease.
Market position is robust in an affluent neighborhood with a 5-kilometer population of 216,991 and average household income of $262,206, supporting premium retail performance amid Toronto's overall low vacancy rates of 1.5 to 2.0 percent in 2025.
Leasing advantages include high visibility, captive footfall from commuters and residents, and opportunities for synergy with the growing residential base projected to increase 30 percent by 2033. Recent renovations have enhanced accessibility and modernized infrastructure, boosting operational quality. However, contextual factors like urban density introduce competition from street-level retail on Yonge Street, where new entrants such as Shake Shack and entertainment venues add vibrancy but fragment consumer spend.
Operational challenges may arise from high maintenance costs in a high-traffic environment and sensitivity to transit disruptions, though the propertys diversified mix mitigates risks from category-specific weaknesses like fashion saturation.
Interested in this property?
Choose how you'd like to proceed
Advertise at this property?
Reach high-intent shoppers across digital screens, atria, and experiential placements.
Hours of Operation
Hours
| Monday | 10:00 AM — 09:00 PM |
| Tuesday | 10:00 AM — 09:00 PM |
| Wednesday | 10:00 AM — 09:00 PM |
| Thursday | 10:00 AM — 09:00 PM |
| Friday | 10:00 AM — 09:00 PM |
| Saturday | 09:30 AM — 06:00 PM |
| Sunday | 12:00 PM — 05:00 PM |
Hours may vary on public holidays. Check with individual stores for specific holiday schedules.
Insights
Demographics and Accessibility
The surrounding area supports strong retail viability with a dense urban demographic: within a 5-kilometer radius, population stands at 216,991, bolstered by young professionals and families drawn to midtown Torontos convenience. Average household income reaches $262,206, enabling discretionary spending on lifestyle and entertainment categories. Accessibility is a major strength, with direct TTC subway linkage driving daily footfall exceeding typical suburban malls; the intersection handles over 100,000 pedestrians weekly. Proximity to Highway 401 aids vehicular access, though parking constraints in this transit-oriented node pose minor drawbacks for drive-in shoppers. Overall, these factors contribute to consistent traffic, with market reports noting resilient performance despite economic pressures.
Tenant Mix and Occupancy
The tenant composition emphasizes necessity and experiential retail, anchored by grocery (Loblaws), entertainment (Cineplex), and fitness (GoodLife), which account for significant draw. Complementary mid-tier brands like Indigo, Sephora, and Winners fill fashion and lifestyle voids, while recent additions such as RBC enhance service-oriented stability. Portfolio-wide RioCan retail occupancy hit 98.4 percent in Q3 2025, suggesting similar strength here given the propertys prime status; Toronto market vacancy hovers at 1.5 percent, indicating low availability for new entrants. Lease terms favor experienced operators, with average rents estimated at $100 to $150 per square foot annually, reflecting location premiums. Drawbacks include occasional anchor turnover risks, as seen in past fashion space repurposing, but the mixes balance reduces exposure to weak categories like apparel amid e-commerce growth.
Competition and Market Risks
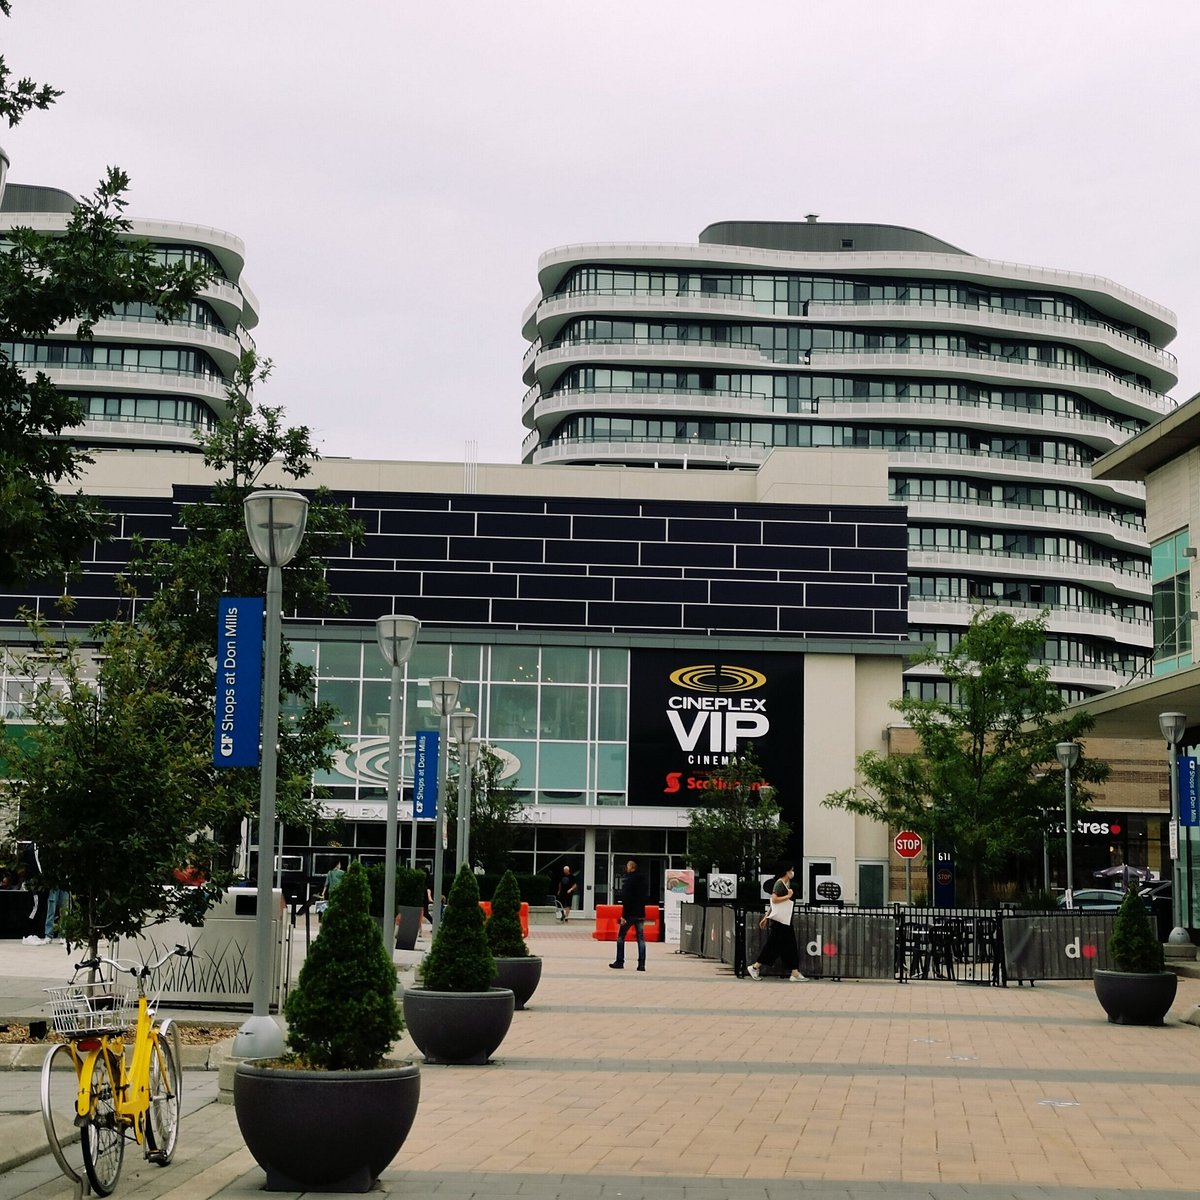
Yonge Eglinton faces moderate competition from nearby power centers like Shops at Don Mills and high-street retail along Yonge corridor, where emerging tenants including Hard Rock Cafe and Value Village intensify experiential offerings, potentially diverting youth demographics. Broader Toronto retail saturation in fashion and dining categories pressures margins, with sales per square foot averaging $1,000 to $1,500 across similar midtown assets per ICSC data. Economic risks include inflation impacting high-income spending and transit dependency exposing to service interruptions. Infrastructure remains modern post-renovation, but aging elements in surrounding areas could indirectly affect appeal. Mitigation lies in the propertys mixed-use integration, fostering captive audiences and supporting 4.6 percent same-property NOI growth for RioCan in recent quarters, though retailers should monitor online shifts eroding physical footfall by 10 to 15 percent annually.
Building Details
Detailed Market Analytics
City Snapshot
Toronto, ON
Comprehensive market intelligence for retail expansion in this city

Other Retail Destinations in Toronto
Discover more shopping centers in Toronto.

Popular in Canada
Top retail destinations across Canada.



Interested in this property?
Choose how you'd like to proceed
Advertise at this property?
Reach high-intent shoppers across digital screens, atria, and experiential placements.
City Snapshot
Toronto, ON
Comprehensive market intelligence for retail expansion in this city