Brand Fit Snapshot
Best for:
Not ideal if:
Similar properties you might like:
Quick assessment - takes 30 seconds
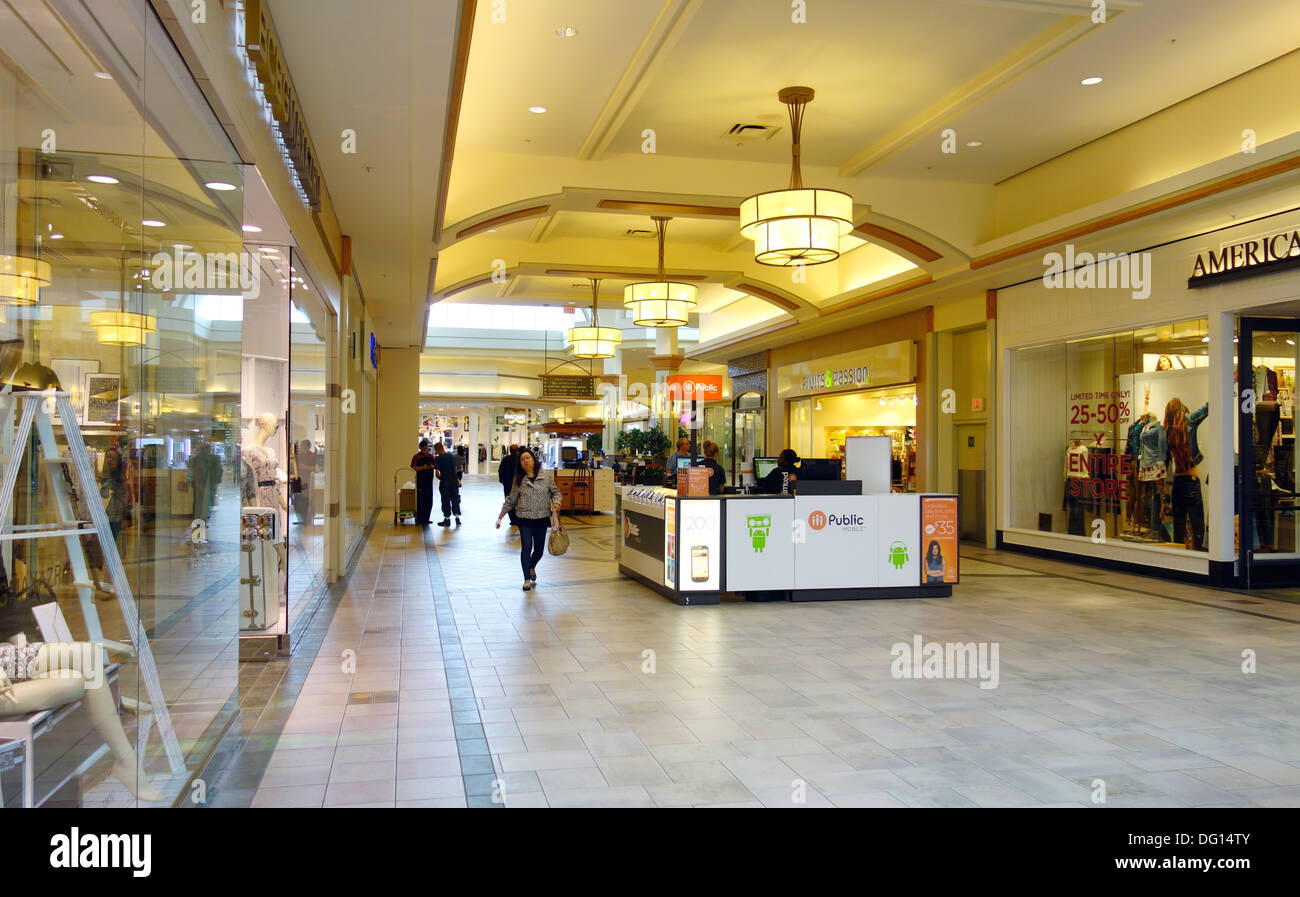
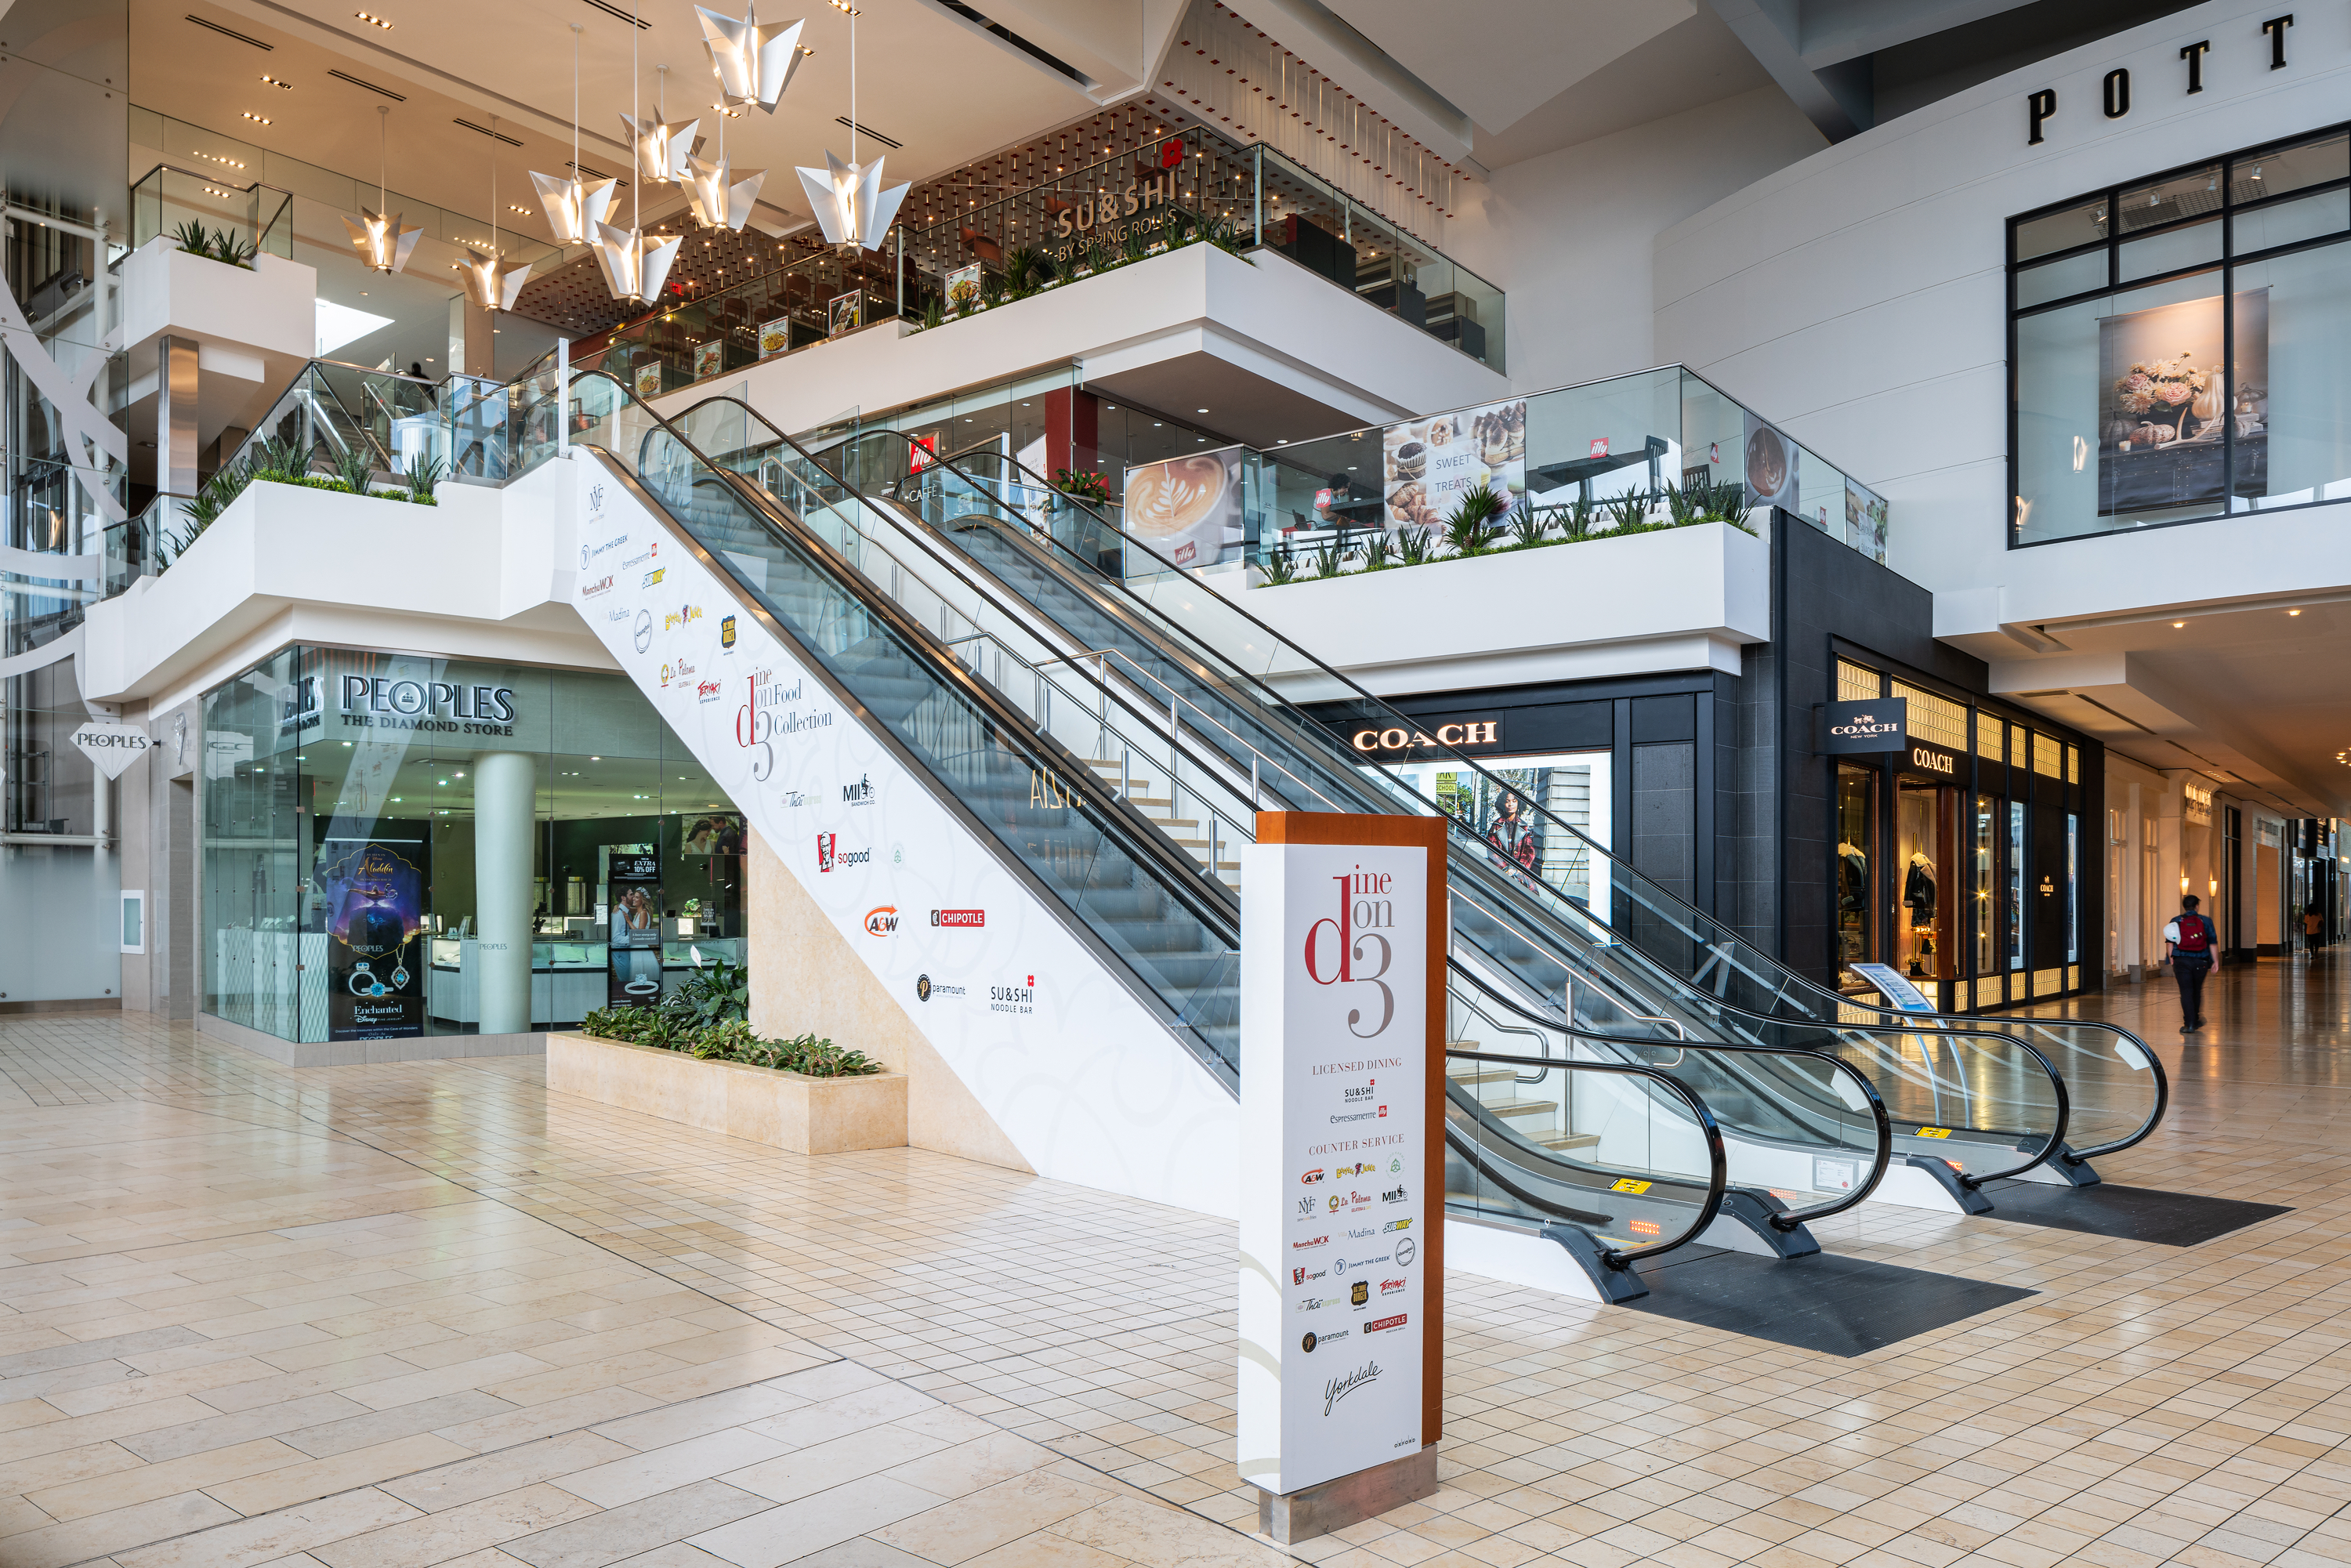
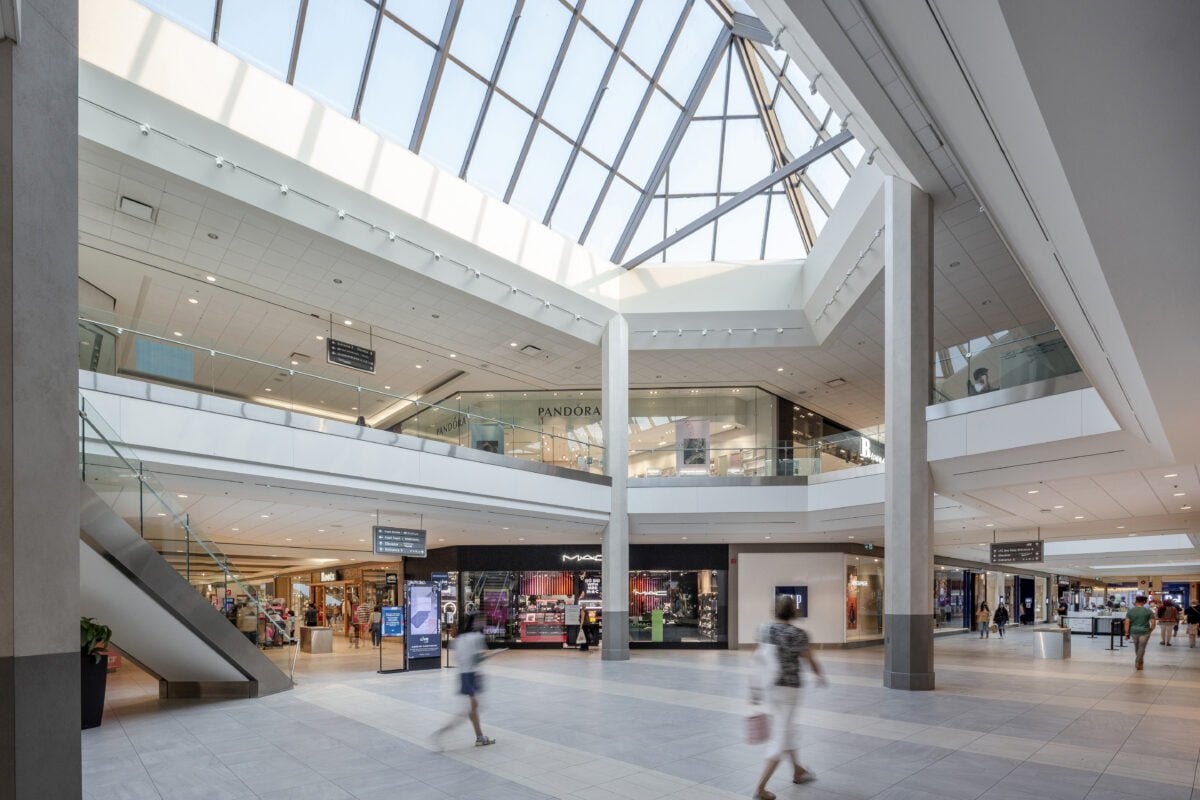
Metropolis at Metrotown in Burnaby Metrotown neighbourhood is British Columbia largest shopping centre with 1.6 million square feet gross leasable area over three levels. Established 1986 expanded 2005 owned by Ivanhoé Cambridge it features over 330 stores including anchors Hudson Bay Walmart T&T Supermarket Sport Chek Indigo H&M Cineplex Uniqlo Sephora Apple Store.
Tenant mix includes 40 percent food services groceries 30 percent apparel accessories 30 percent entertainment services others with Western Canada largest food court over 30 eateries recent additions JD Sports planned Foot Locker expansions. Attracts 27 million annual visitors average dwell time 98 minutes conversion rate 30 percent supported by direct Metrotown SkyTrain station access handling 50,000 daily passengers major bus exchanges 8,500 parking spaces.
Occupancy 96.6 percent above suburban average base rents 50-90 dollars per square foot NNN averaging 600 CAD per square meter sales productivity 1,142 dollars per square foot. Catchment area 5 km radius 500,000 residents median household income 83,000 CAD median age 40.4 years 70.5 percent tertiary education diverse affluent multicultural profile. Strong market position Greater Vancouver dominant regional hub though competes with Crystal Mall Asian focus Old Orchard convenience downtown experiential retail e-commerce impacts seen closures Toys R Us 2024 Sears 2018.
Leasing advantages high footfall proactive strategies medium leasing velocity up to 5,000 square meters available space challenges category saturation fashion groceries high rents 30-year redevelopment disruptions construction tenant relocations peak-hour congestion transit reliance.
Operational quality high BOMA BEST Platinum certification net zero carbon target 2040 comprehensive security marketing events 40 percent engagement digital adoption 95 percent growth potential 2 percent annual.
Interested in this property?
Choose how you'd like to proceed
Advertise at this property?
Reach high-intent shoppers across digital screens, atria, and experiential placements.
Hours of Operation
Hours
| Monday | 10:00 AM — 09:00 PM |
| Tuesday | 10:00 AM — 09:00 PM |
| Wednesday | 10:00 AM — 09:00 PM |
| Thursday | 10:00 AM — 09:00 PM |
| Friday | 10:00 AM — 09:00 PM |
| Saturday | 10:00 AM — 09:00 PM |
| Sunday | 11:00 AM — 07:00 PM |
Hours may vary on public holidays. Check with individual stores for specific holiday schedules.
Insights
Demographic Profile
Immediate 5 km trade area encompasses 500,000 residents in Southwest Burnaby with median household income 83,000 CAD average household size 2.5 persons median age 40.4 years 70.5 percent tertiary education attainment reflecting diverse multicultural consumer-oriented population. Broader 20 km radius includes 948,000 people average income 103,000 CAD 5.5 percent economic growth index 125 Canada 100. Consumer spending strong 12,000 CAD annually apparel 1,200 CAD cosmetics 6,500 CAD groceries 1,100 CAD electronics supporting retail performance. However economic pressures Greater Vancouver may impact discretionary spending multicultural diversity aids broad tenant appeal but requires culturally sensitive merchandising to avoid mismatches.
Accessibility and Footfall
Excellent accessibility via direct connection Metrotown SkyTrain station second busiest Lower Mainland 50,000 daily 8 million annual passengers plus bus exchanges 8,500 on-site parking enhances draw. Generates 27 million annual visitors 1.83 million monthly footfall 98-minute average dwell time 30 percent conversion rate 25 percent traffic quality driving sales 10,500 CAD yearly per unit. Advantages include reliable public transit reducing car dependency high density urban setting boosts impulse buys. Drawbacks involve peak-hour congestion logistics challenges goods delivery customer flow management potential delays during SkyTrain disruptions or events increasing operational costs for tenants reliant on timely access.
Competition and Risks
Intense competition from nearby Crystal Mall Asian-oriented tenants Old Orchard Shopping Centre convenience focus Vancouver downtown experiential retail e-commerce leading closures like Toys R Us 2024 Sears 2018. Medium tenant mix risk category saturation fashion groceries limits new entrant opportunities high rents 50-90 PSF NNN barrier smaller retailers. Ongoing 30-year master plan redevelopment mixed-use urban core introduces short-term disruptions construction noise tenant relocations temporary footfall dips. Market saturation weak categories aging infrastructure minimal but transit reliance exposes to public transport issues broader retail trends favor experiential over traditional formats requiring adaptive leasing terms to mitigate vacancy risks maintain vibrancy.
Building Details
Detailed Market Analytics
City Snapshot
Burnaby, BC
Comprehensive market intelligence for retail expansion in this city

Other Retail Destinations in Burnaby
Discover more shopping centers in Burnaby.


Popular in Canada
Top retail destinations across Canada.


Interested in this property?
Choose how you'd like to proceed
Advertise at this property?
Reach high-intent shoppers across digital screens, atria, and experiential placements.
City Snapshot
Burnaby, BC
Comprehensive market intelligence for retail expansion in this city