









Brand Fit Snapshot
Best for:
Not ideal if:
Similar properties you might like:
Quick assessment - takes 30 seconds
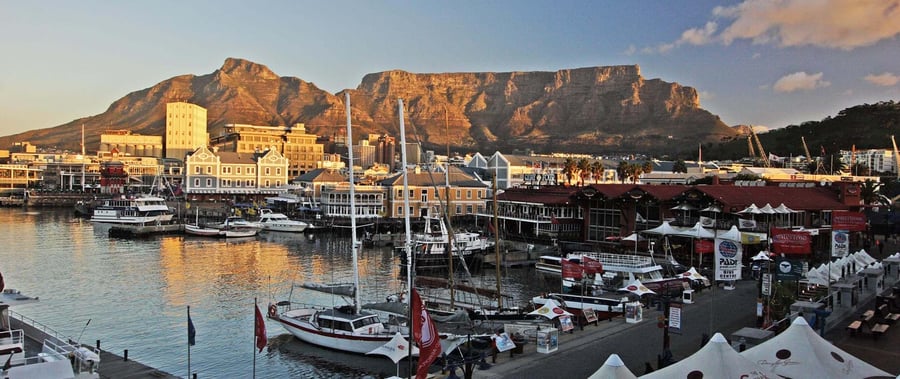
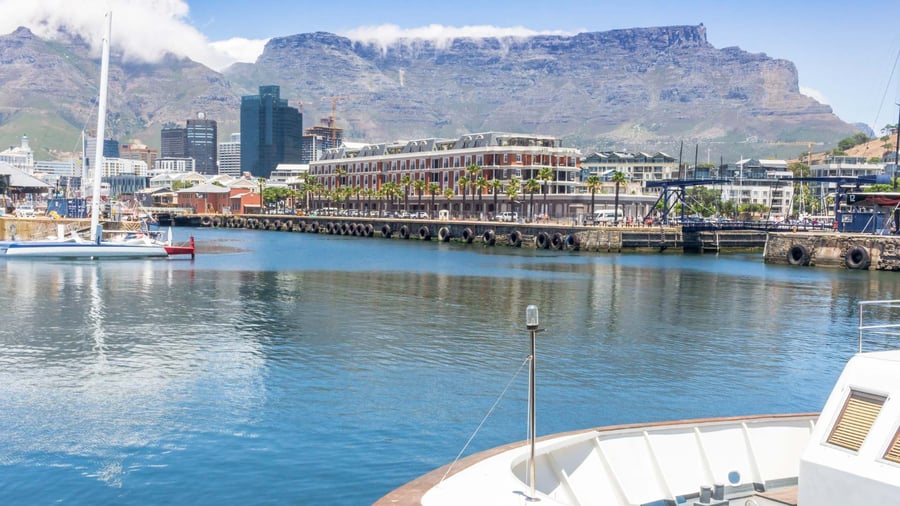
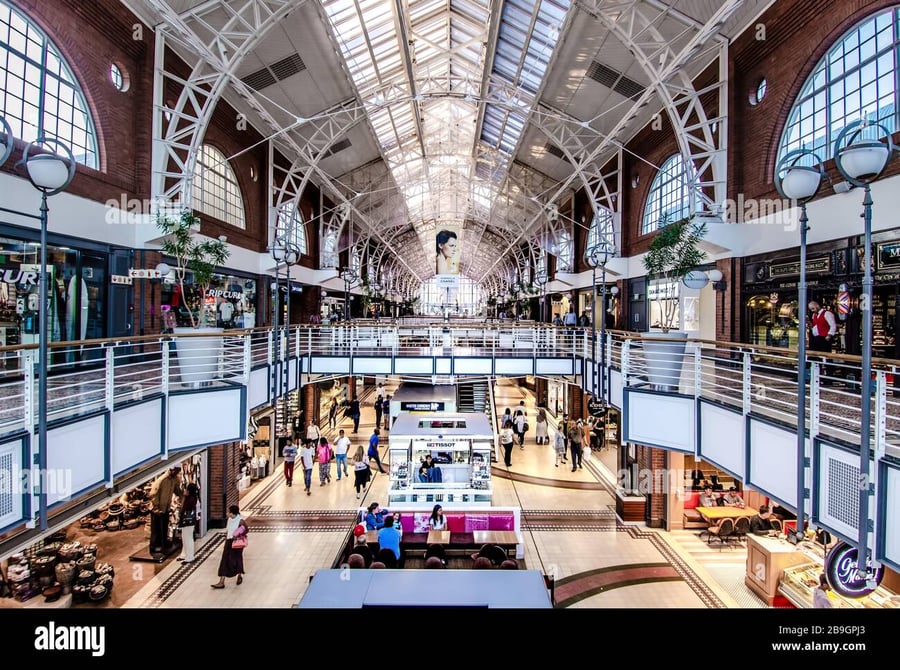
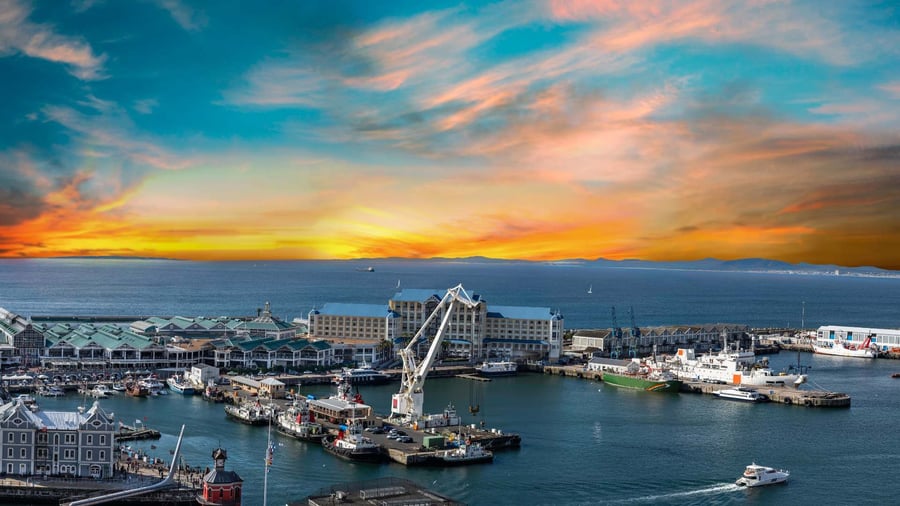
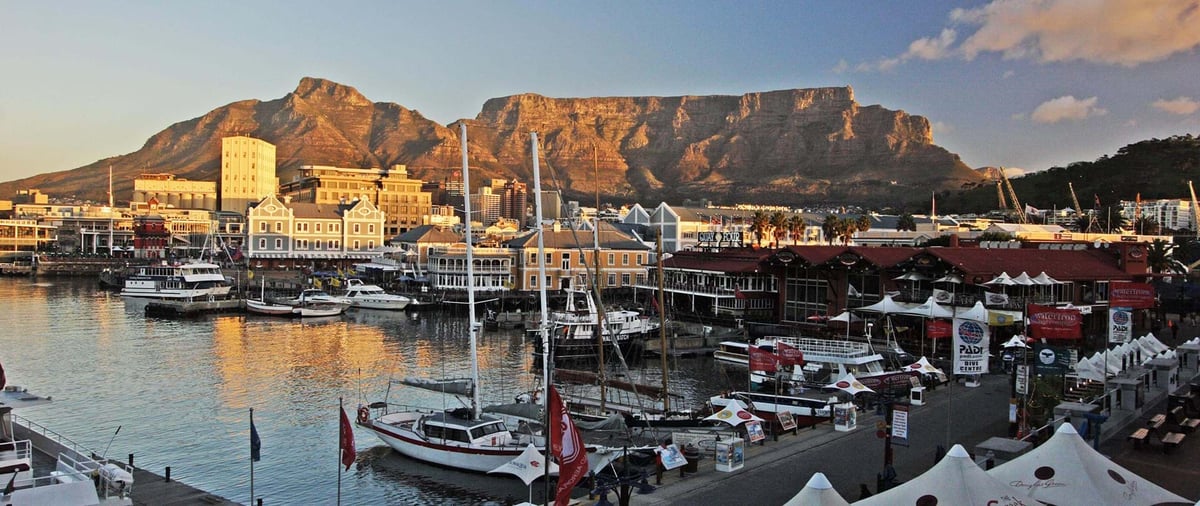
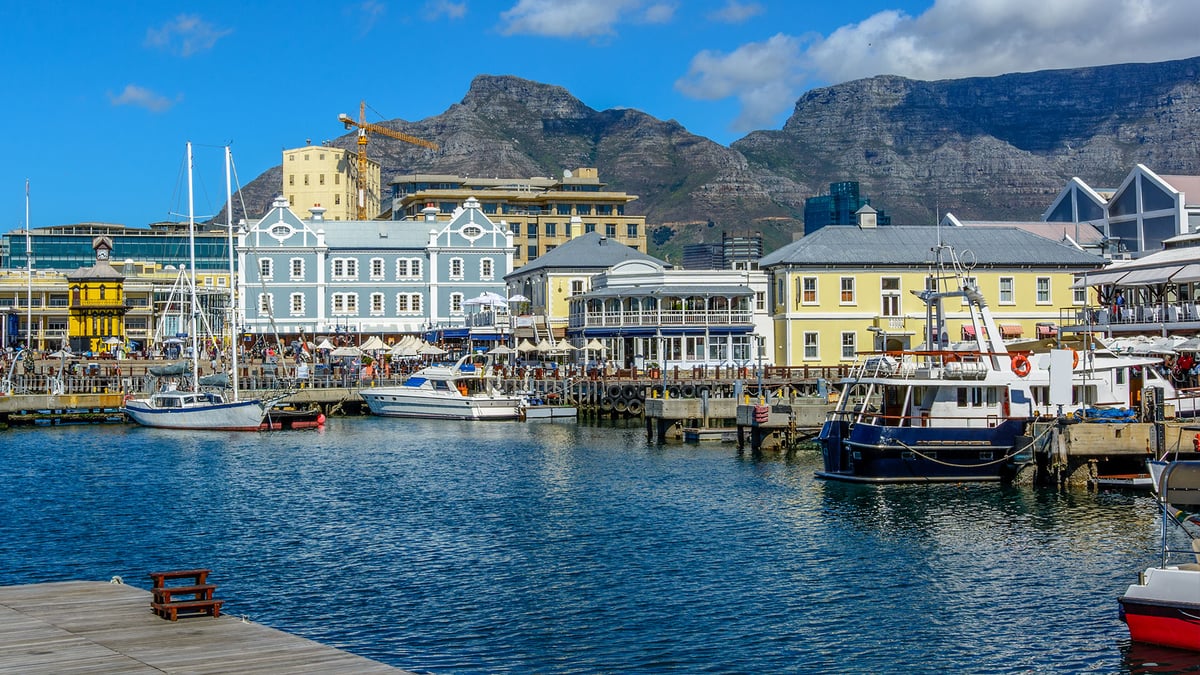
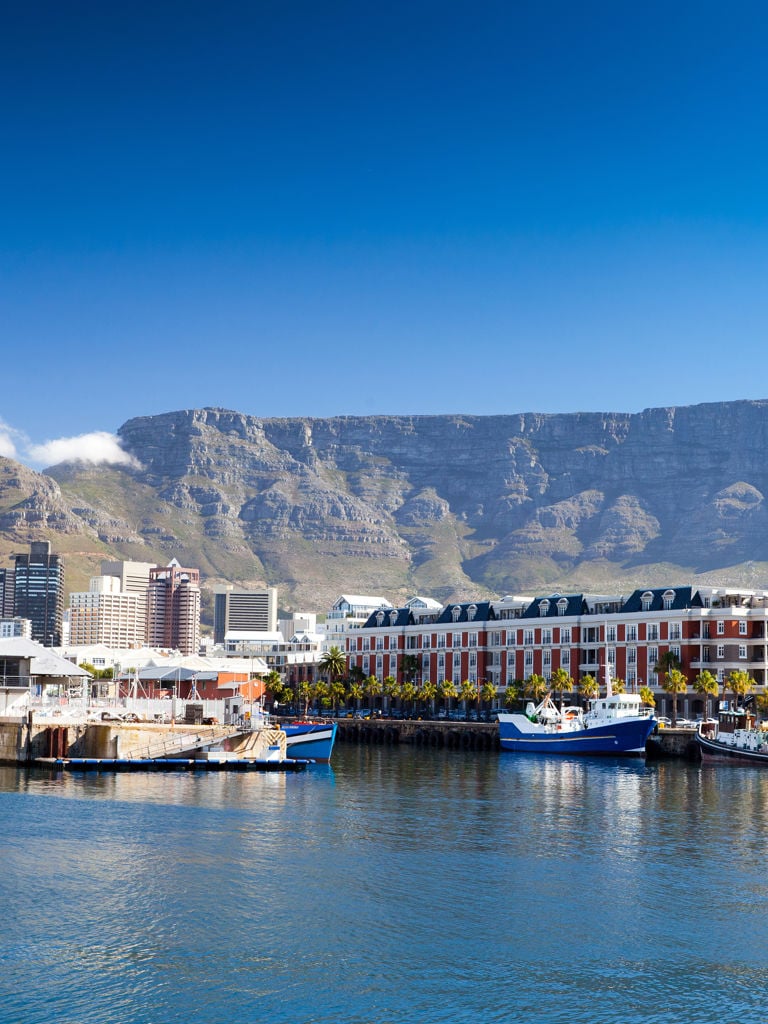
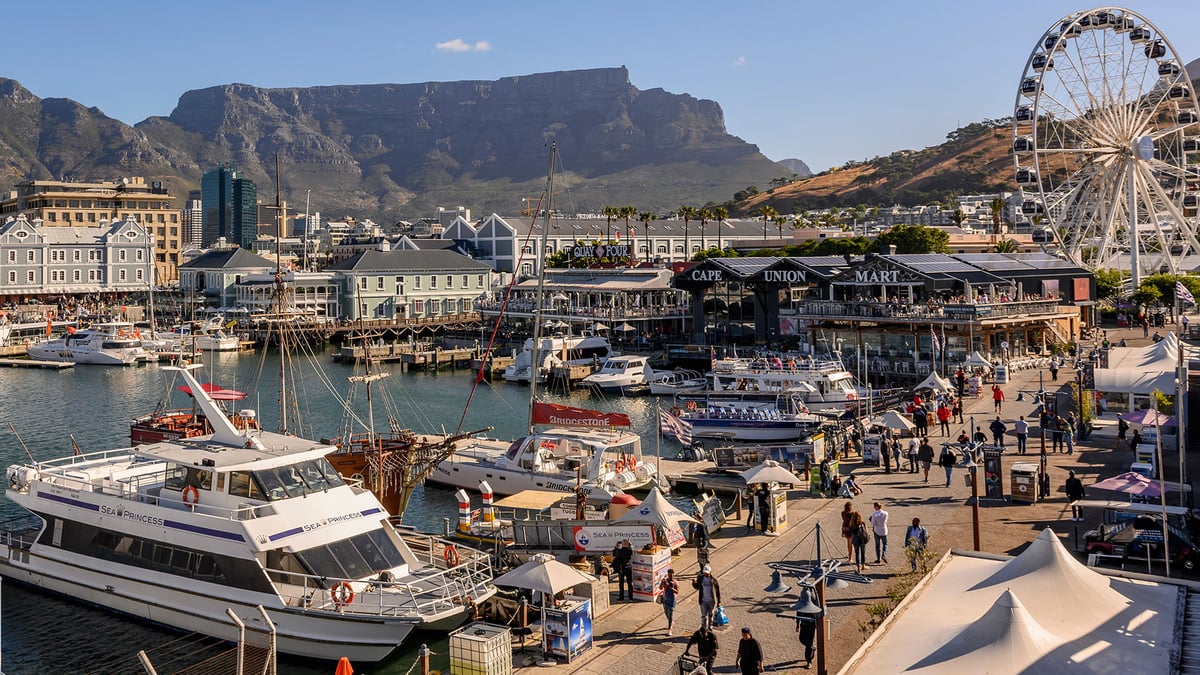
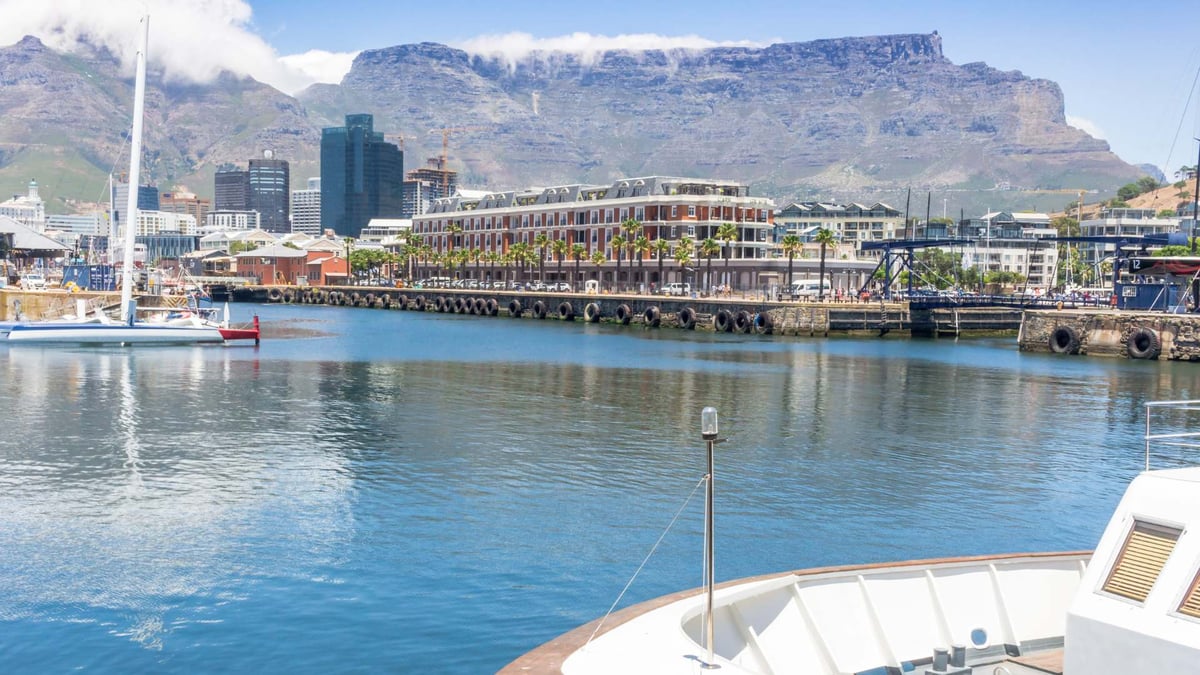
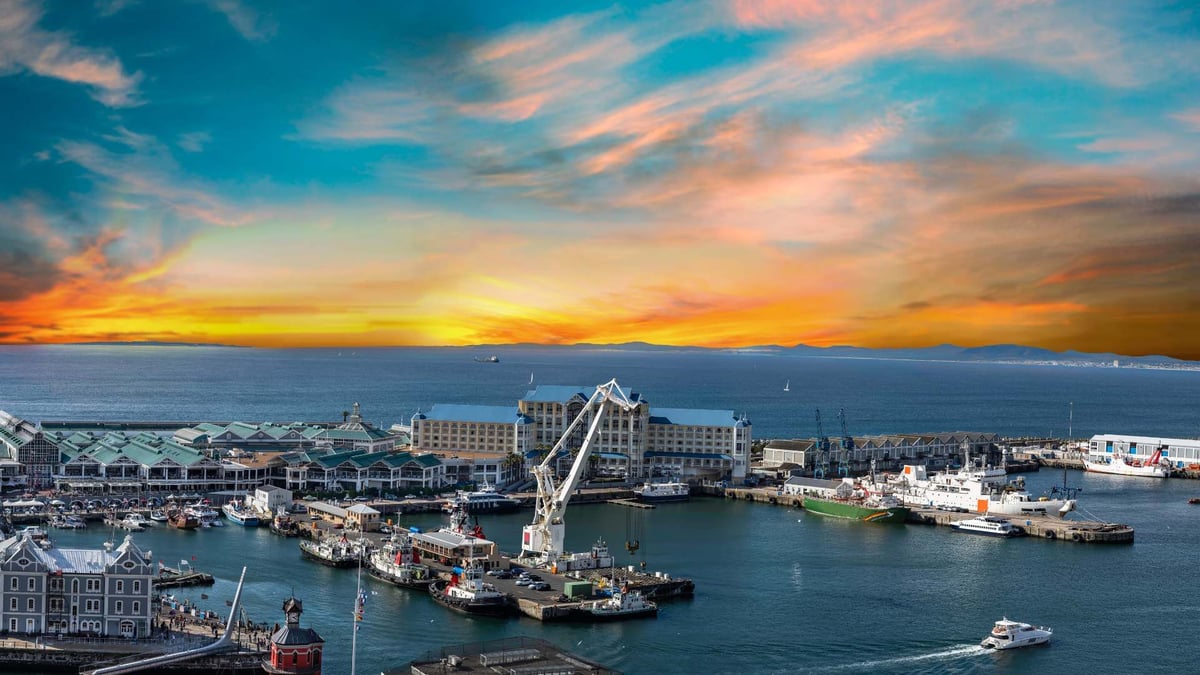
The V&A Waterfront is a premier mixed-use destination in Cape Town, encompassing retail, office, residential, hotel, and entertainment components along the historic Victoria and Alfred harbors.
Spanning approximately 123 hectares, it serves as a key economic hub, generating R3.12 billion in annual revenue as of 2025, with property values increasing 14% year-over-year. It attracts 24 million visitors annually, benefiting from its unique waterfront location that blends heritage architecture with modern developments. The tenant mix includes over 380 retailers, featuring international anchors like Zara, H&M, and Apple, alongside local brands and emerging SMEs, creating a balanced category spread across fashion, lifestyle, dining, and specialty stores.
Occupancy stands at 99.7% with negligible vacancies of 0.3%, reflecting strong demand in a market where Cape Town's retail sector shows resilience amid national economic pressures. Leasing opportunities emphasize turnover-based rents, which rose 109% in recent years due to high sales volumes, supported by data-driven insights from analyzing 11 million transactions via PwC partnership. Advantages include year-round footfall from tourists (over 70% of sales) and affluent locals, excellent accessibility via road, rail, and sea, and robust marketing.
However, challenges involve high base rents estimated at R400-600 per square meter, seasonal tourism dips, and competition from nearby malls like Canal Walk.
Operational quality is high with extended hours (9am-9pm) and top-tier security, but aging infrastructure in heritage zones requires ongoing investment. Market factors such as Cape Town's low unemployment (below 20%) and growing visitor numbers bolster performance, though saturation in fashion categories poses risks for new entrants.
Interested in this property?
Choose how you'd like to proceed
Advertise at this property?
Reach high-intent shoppers across digital screens, atria, and experiential placements.
Hours of Operation
Hours
| Monday | 09:00 AM — 09:00 PM |
| Tuesday | 09:00 AM — 09:00 PM |
| Wednesday | 09:00 AM — 09:00 PM |
| Thursday | 09:00 AM — 09:00 PM |
| Friday | 09:00 AM — 09:00 PM |
| Saturday | 09:00 AM — 09:00 PM |
| Sunday | 09:00 AM — 09:00 PM |
Hours may vary on public holidays. Check with individual stores for specific holiday schedules.
Insights
Demographics and Footfall
The V&A Waterfront draws a diverse demographic profile, with over 70% of retail sales from international tourists primarily from Europe, the UK, and the US, alongside domestic visitors and local middle-to-upper-income residents aged 25-55, including families and young professionals. Annual footfall reaches 24 million, peaking during summer (October-March) due to Cape Town's tourism season, providing consistent exposure. This mix supports high per-visitor spend, averaging above national mall benchmarks, but reliance on seasonal influxes introduces variability, with slower periods in winter potentially impacting sales for non-essential retail categories.
Occupancy and Rent Levels
Occupancy at the V&A Waterfront remains exceptionally high at 99.7%, with vacancies at just 0.3%, indicating strong tenant demand and minimal turnover risk in Cape Town's competitive retail landscape. Rent structures combine base rates of approximately R400-600 per square meter per annum with turnover rentals, which have driven a 109% increase in income recently, fueled by robust sales. While this model aligns costs with performance, it exposes tenants to revenue fluctuations; high operational expenses, up 44% year-over-year, could strain margins for smaller retailers amid inflation pressures.
Competition and Market Risks
The V&A Waterfront faces competition from major Cape Town malls like Canal Walk (largest enclosed center) and Gateway, which offer broader category mixes but lack its tourism draw and lifestyle appeal. Market saturation in fashion and dining categories may challenge new entrants, while external risks include economic slowdowns affecting tourism and online retail encroachment reducing physical footfall. Strengths lie in its irreplaceable waterfront positioning and integrated offerings, yet access issues during peak tourist seasons and potential infrastructure upgrades in older sections could elevate costs. Overall, it maintains a leading market position with 13.4% like-for-like net property income growth.
Building Details
Detailed Market Analytics
City Snapshot
Cape Town
Comprehensive market intelligence for retail expansion in this city

Other Retail Destinations in Cape Town
Discover more shopping centers in Cape Town.






Popular in South Africa
Top retail destinations across South Africa.





Interested in this property?
Choose how you'd like to proceed
Advertise at this property?
Reach high-intent shoppers across digital screens, atria, and experiential placements.
City Snapshot
Cape Town
Comprehensive market intelligence for retail expansion in this city