







Brand Fit Snapshot
Best for:
Not ideal if:
Similar properties you might like:
Quick assessment - takes 30 seconds
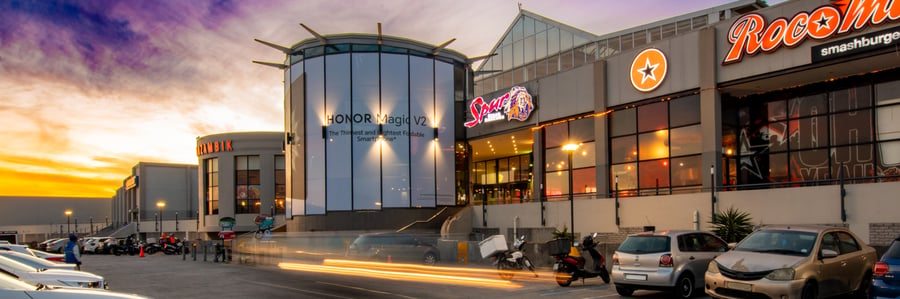
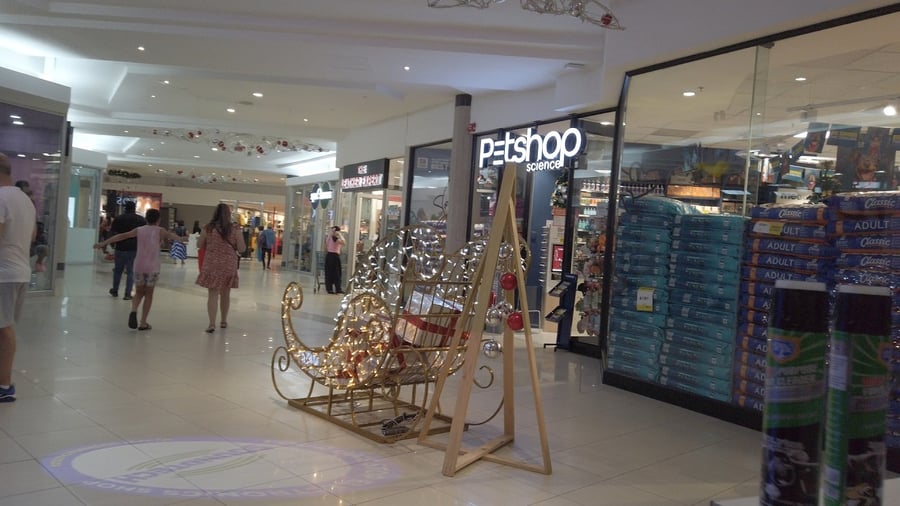
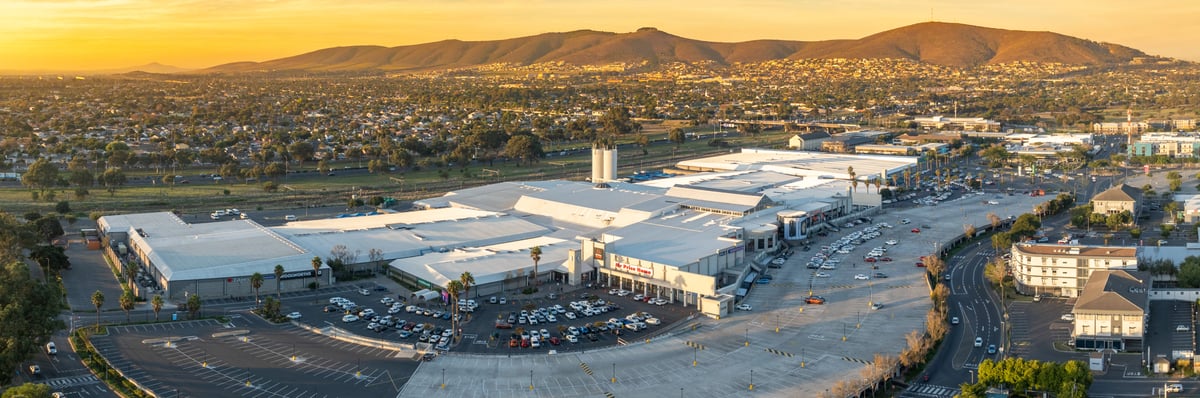
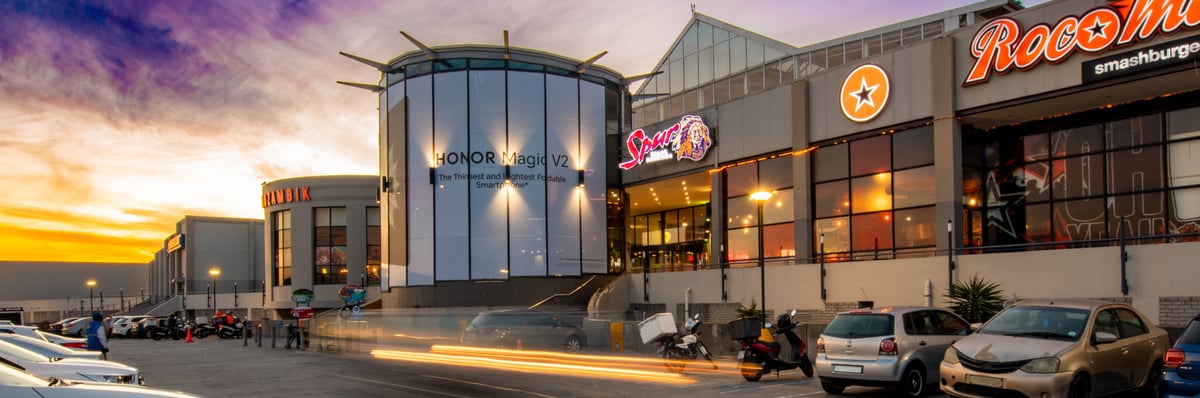
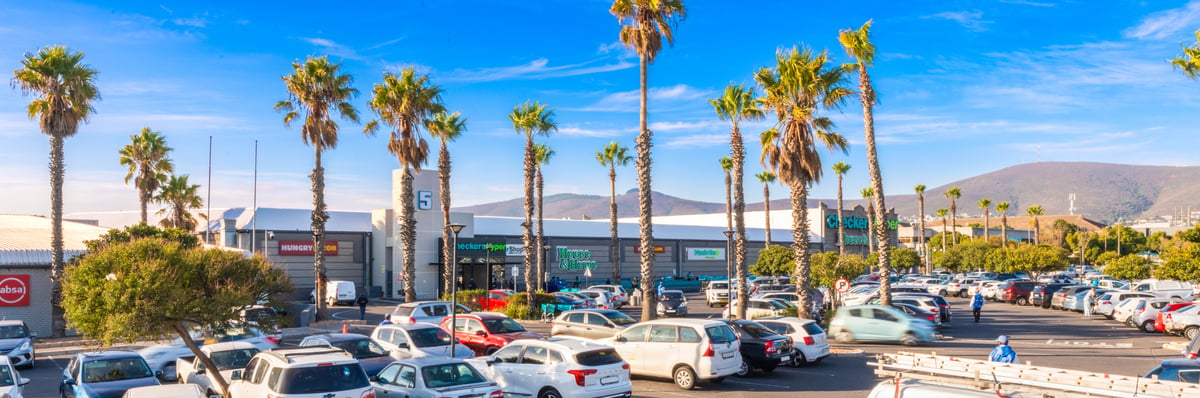
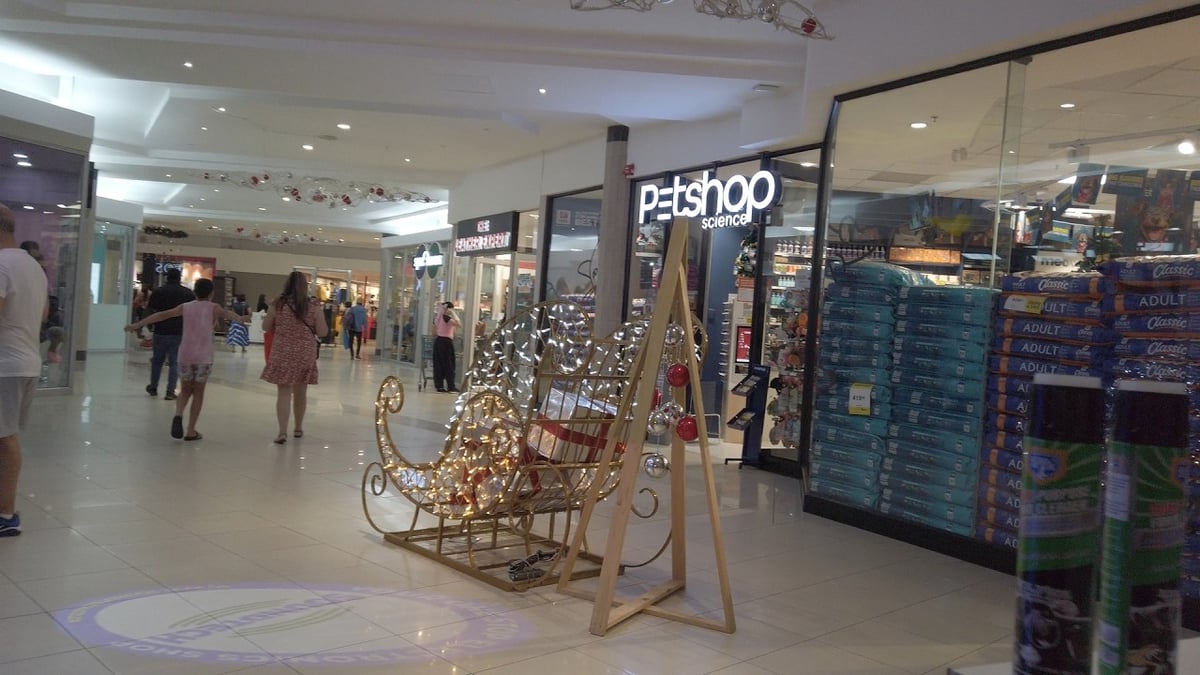
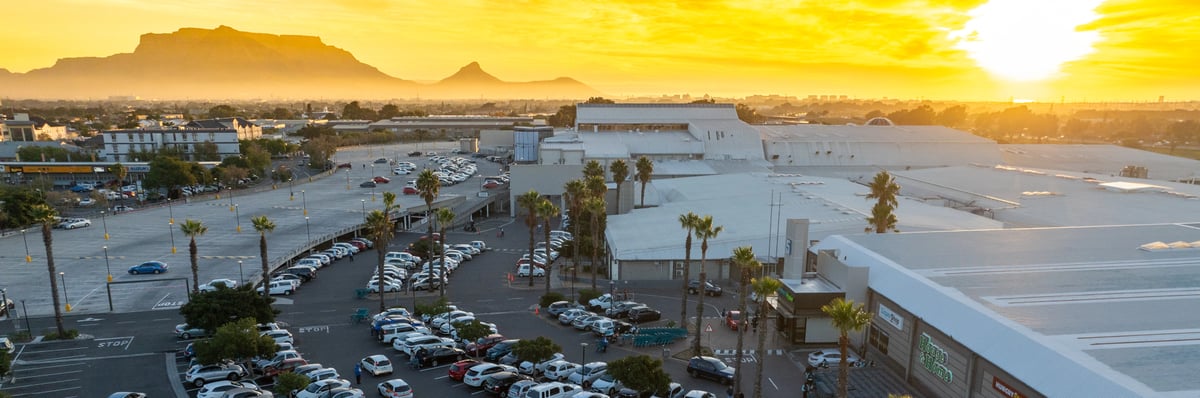
N1 City Mall is a regional shopping center in Goodwood, northern suburbs of Cape Town, South Africa, opened in 1990 and spanning 64,209 square meters of gross leasable area. It features over 140 stores and restaurants, positioning it as the fourth largest mall in the Western Cape. The tenant mix emphasizes convenience retail with anchors including Checkers Hypermarket, Game, and Edgars, complemented by fashion outlets like Ackermans, Truworths, and Pep, beauty and health stores such as Dis-Chem, tech and electronics from Incredible Connection, homeware from @Home, and dining options.
Entertainment includes Ster-Kinekor cinemas and Wonderland kids area. The catchment serves a diverse, middle to lower-middle income population in areas like Parow and Bellville, with strong family demographics supporting everyday shopping needs.
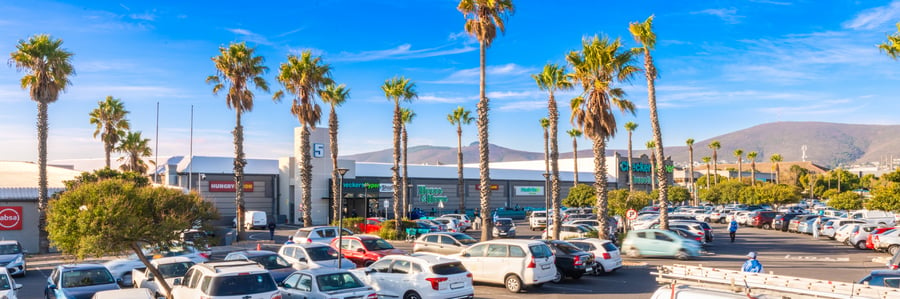
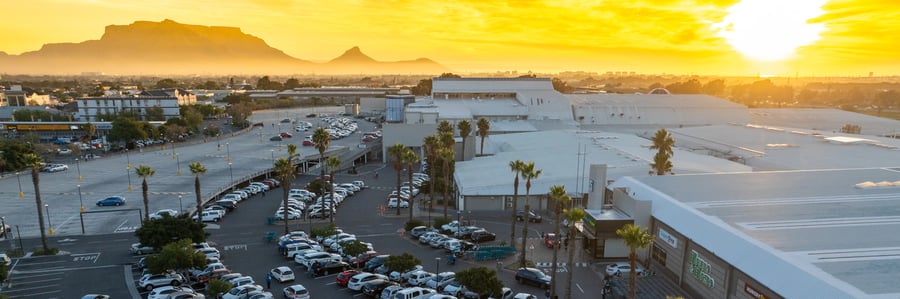
Accessibility benefits from N1 highway proximity, providing free parking for 3,200 vehicles, though reliance on personal transport limits broader appeal. Recent Growthpoint reports note footfall growth and 4.8% trading density increase in FY25, with occupancy exceeding 95%.
Rent levels align with regional averages at R250-R350 per square meter monthly.
Market position as a community hub offers stable leasing for essentials-focused retailers, but faces drawbacks from competition with premium malls like Canal Walk and Tyger Valley, economic volatility impacting spending, and potential aging infrastructure requiring upkeep. Saturation in grocery and fashion categories poses risks, yet the malls operational quality remains reliable for local trade.
Interested in this property?
Choose how you'd like to proceed
Advertise at this property?
Reach high-intent shoppers across digital screens, atria, and experiential placements.
Hours of Operation
Hours
| Monday | 09:00 AM — 07:00 PM |
| Tuesday | 09:00 AM — 07:00 PM |
| Wednesday | 09:00 AM — 07:00 PM |
| Thursday | 09:00 AM — 07:00 PM |
| Friday | 09:00 AM — 07:00 PM |
| Saturday | 09:00 AM — 05:00 PM |
| Sunday | 09:00 AM — 05:00 PM |
Hours may vary on public holidays. Check with individual stores for specific holiday schedules.
Insights
Catchment Area and Demographics
N1 City Mall draws from a 10km radius catchment of about 500,000 residents in Cape Lownorthern suburbs, characterized by LS M6-LS M8 income brackets (middle to lower-middle class). Over 60% of households include children under 18, driving demand for family-oriented retail like groceries and entertainment. The area features diverse ethnic groups, including significant Coloured and Black African populations, with unemployment around 25% influencing preference for value-driven purchases. Footfall averages 5-6 million annual visitors, primarily for convenience shopping, supported by residential density but challenged by economic pressures reducing discretionary spend on fashion and leisure.
Competition and Market Factors
The mall competes with nearby centers like Bayside Mall (GLA 40,000m2, upscale focus), Tyger Valley Shopping Centre (GLA 100,000m2, premium tenants), and Canal Walk (GLA 90,000m2, destination retail). N1 City holds a niche in affordable, everyday essentials amid Cape Town market saturation, where retail vacancy rates hover at 5-7%. Strengths include highway visibility and loyal local trade, but weaknesses arise from limited luxury appeal and public transport access, potentially capping footfall growth. Broader market trends show resilient grocery sales but softening in apparel due to e-commerce rise and inflation, with overall Western Cape retail turnover up 3% YoY per 2024 reports.
Lease Terms and Operational Quality
Leasing opportunities feature flexible spaces from 50-1,000m2 in high-traffic zones, with base rents of R250-R350/m2/month plus turnover escalations (8-10% of sales over thresholds). Occupancy at 96% reflects strong demand for anchor and mid-tier tenants, aided by professional management from Growthpoint. Advantages include low vacancy risks and community events boosting traffic, but drawbacks encompass economic sensitivity in SA, where load-shedding disrupts operations, and competition pressures on rent negotiations. Infrastructure, built in 1990, shows good maintenance but may need upgrades for modern amenities, impacting long-term appeal. Overall, suitable for resilient categories like food and health, with average lease terms of 3-5 years.
Building Details
Detailed Market Analytics
City Snapshot
Cape Town
Comprehensive market intelligence for retail expansion in this city

Other Retail Destinations in Cape Town
Discover more shopping centers in Cape Town.





Popular in South Africa
Top retail destinations across South Africa.




Interested in this property?
Choose how you'd like to proceed
Advertise at this property?
Reach high-intent shoppers across digital screens, atria, and experiential placements.
City Snapshot
Cape Town
Comprehensive market intelligence for retail expansion in this city