
Brand Fit Snapshot
Best for:
Not ideal if:
Similar properties you might like:
Quick assessment - takes 30 seconds
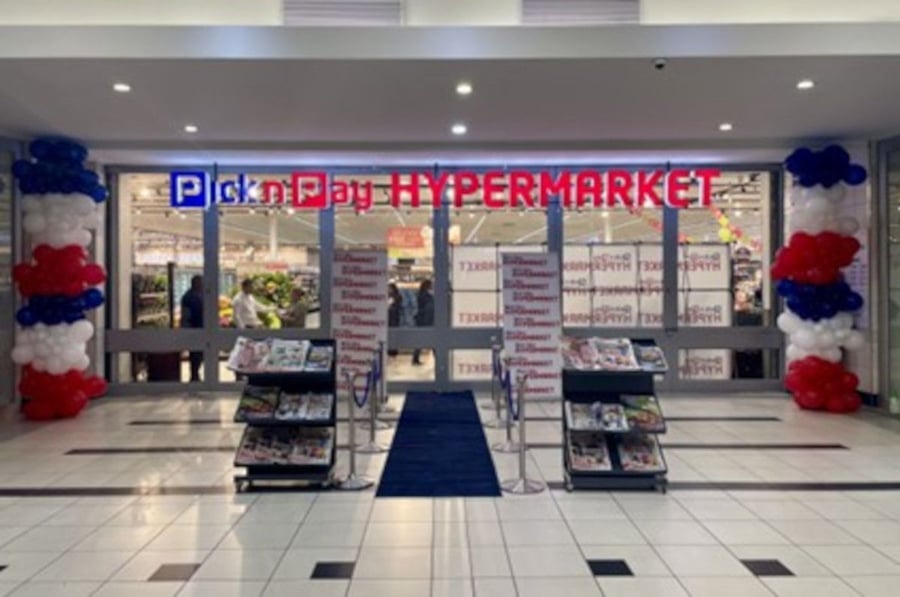
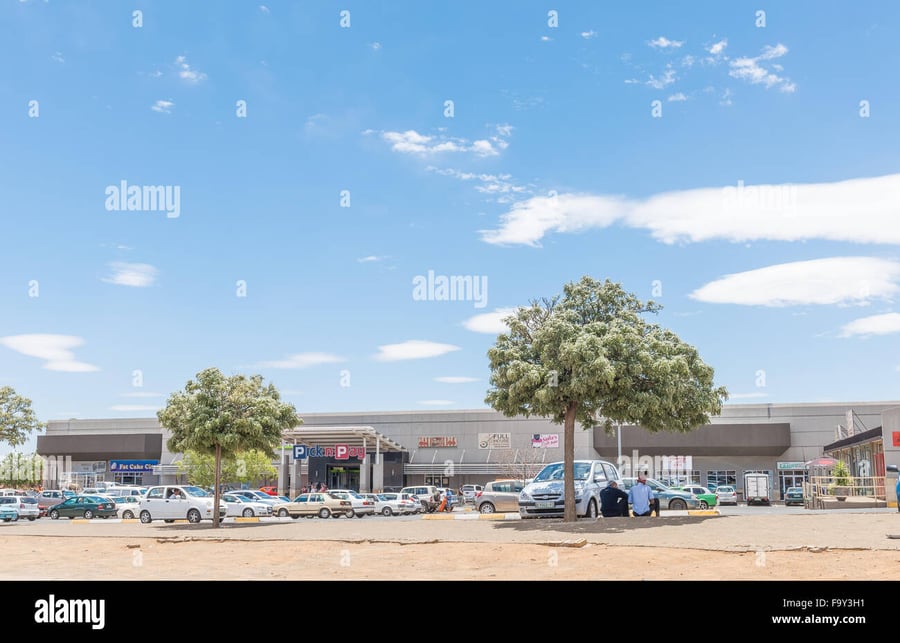
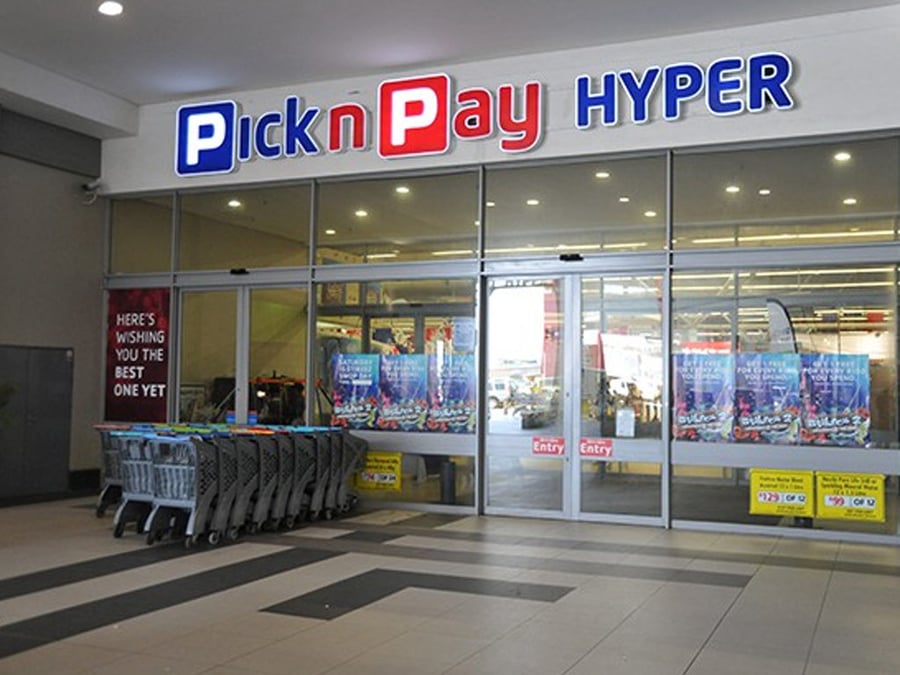
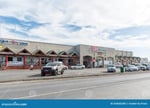
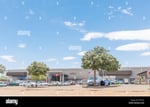
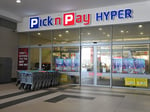
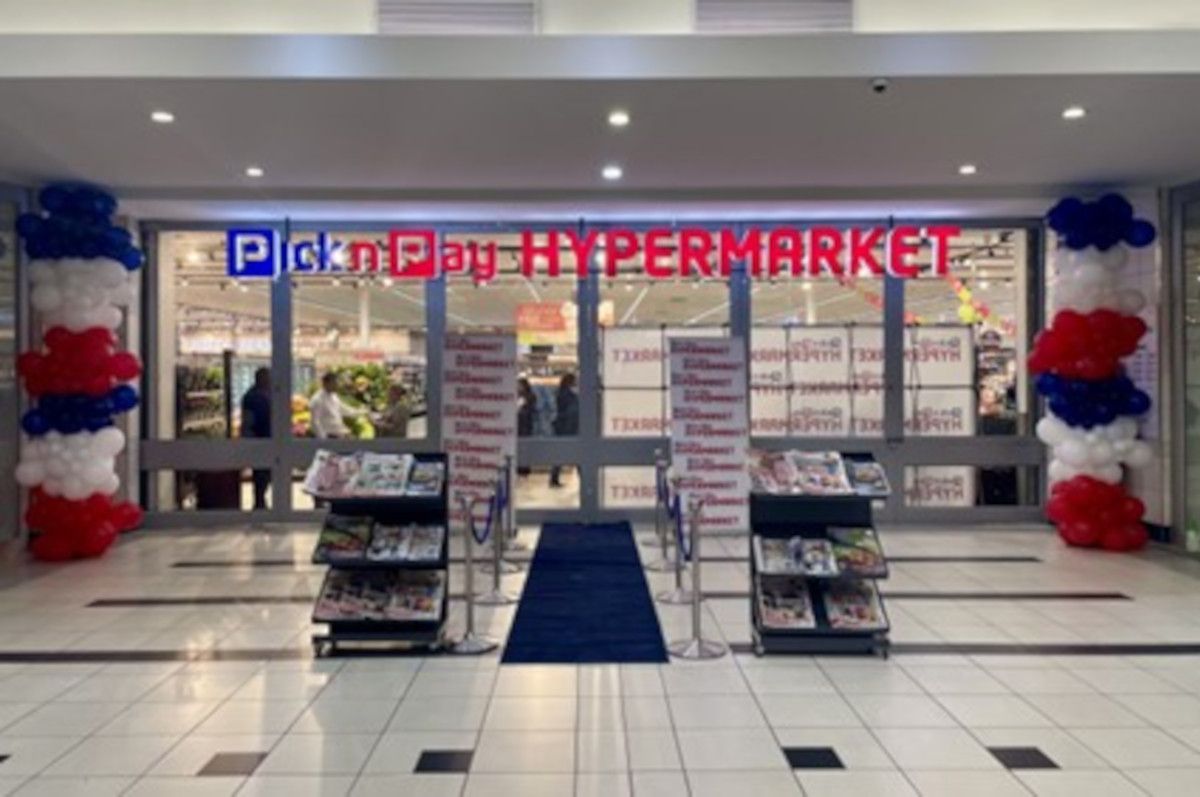
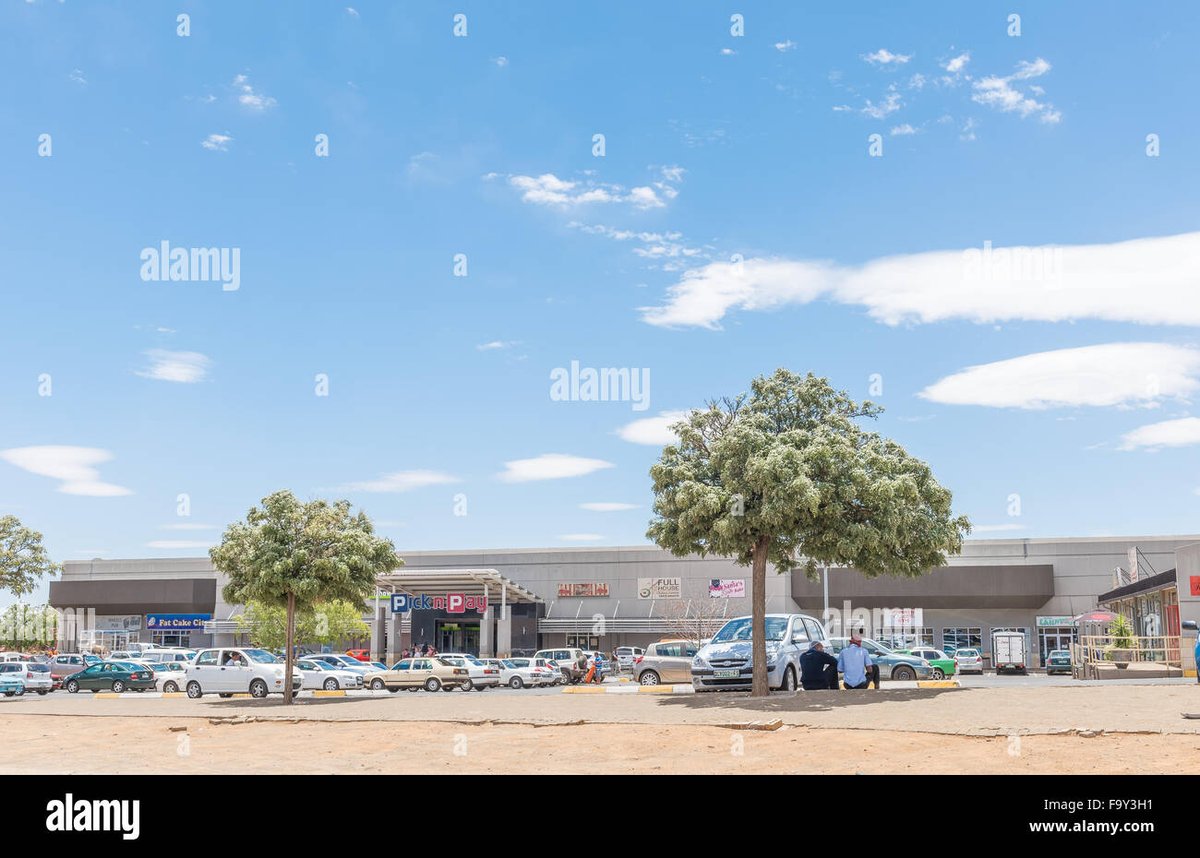
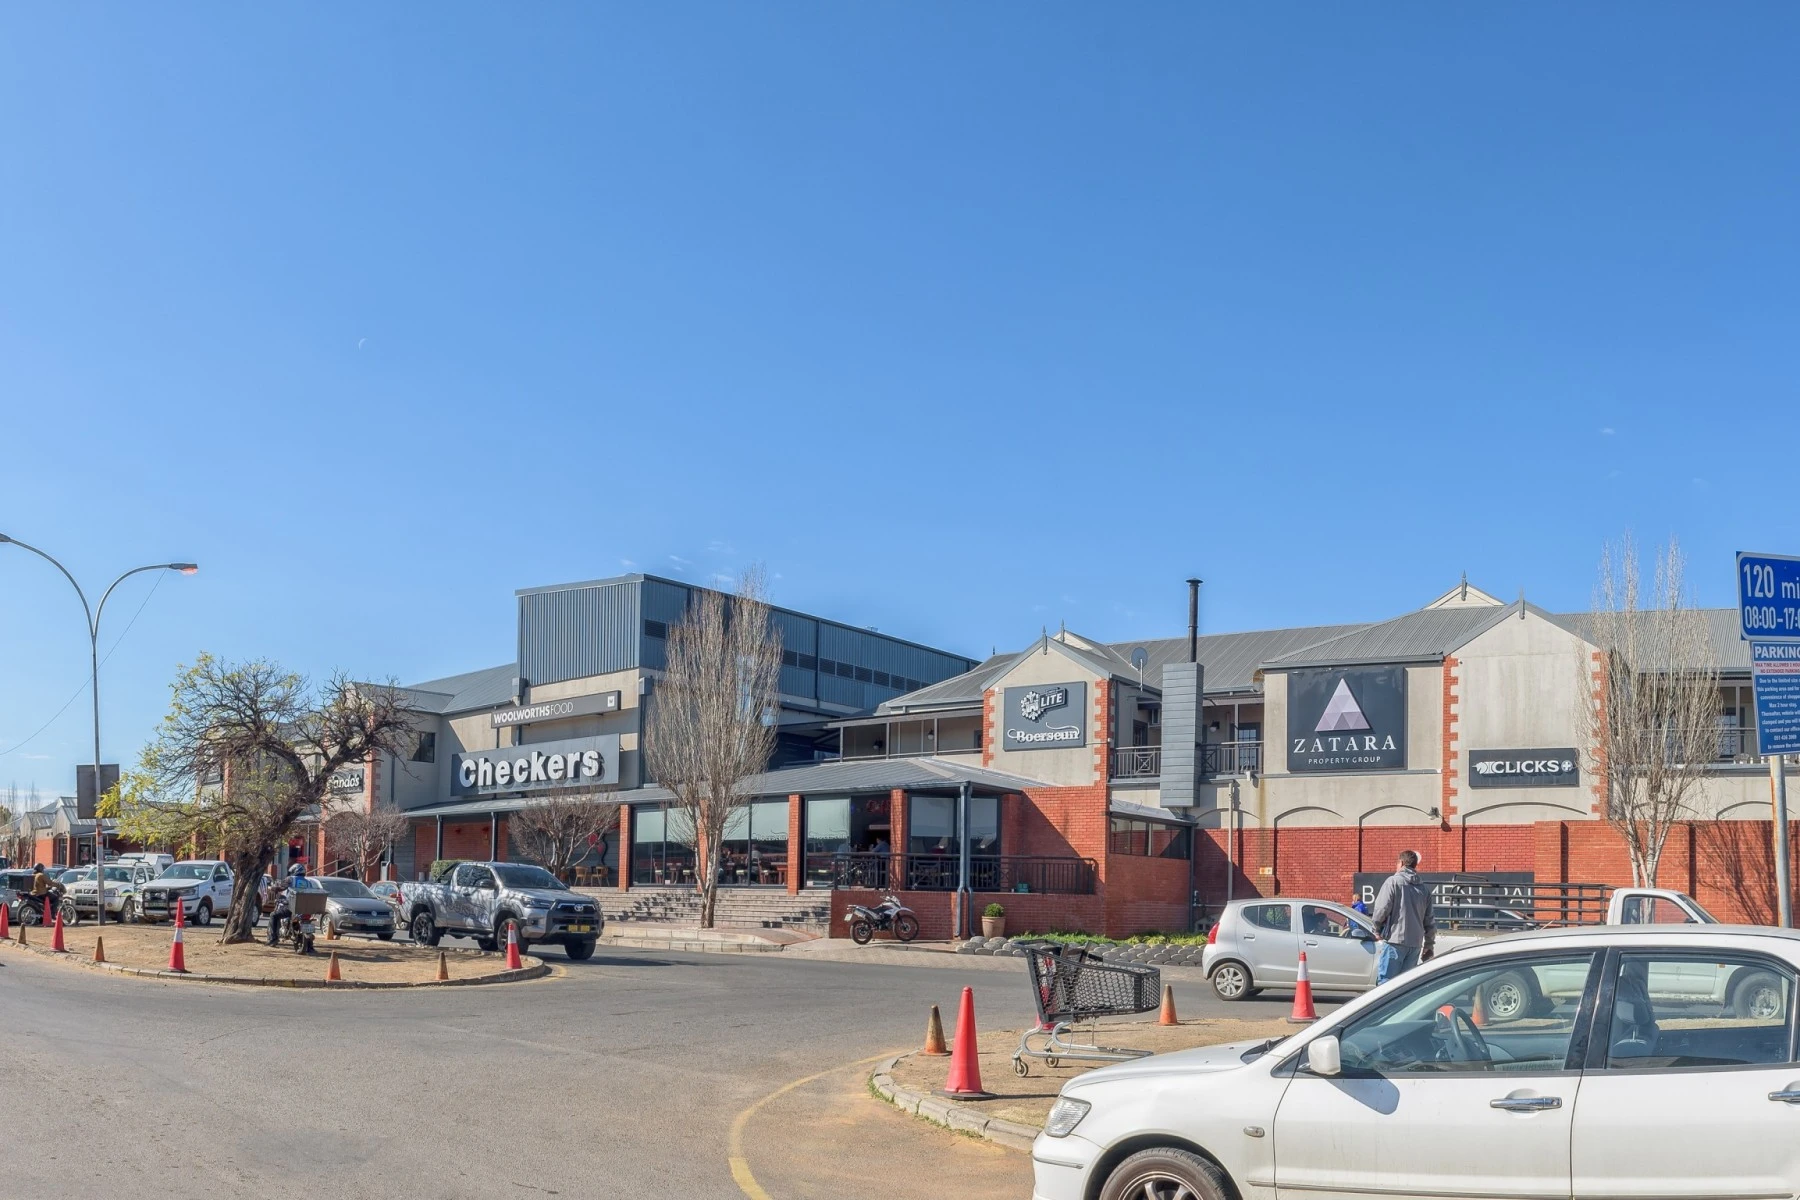
Located at 111 Benade Drive in Bloemfontein, South Africa, this retail property is a single-level hypermarket built in 1995 with a gross leasable area of 8,000 square meters. It serves as a dominant grocery anchor in a secondary market city, drawing from a primary catchment of 150,000 residents within 5 km and secondary up to 20 km. The property features 400 parking spaces and direct access to main roads, with moderate public transport and medium pedestrian traffic.
Annual footfall stands at 750,000 visitors, supported by an average dwell time of 45 minutes and a 2% projected growth rate.
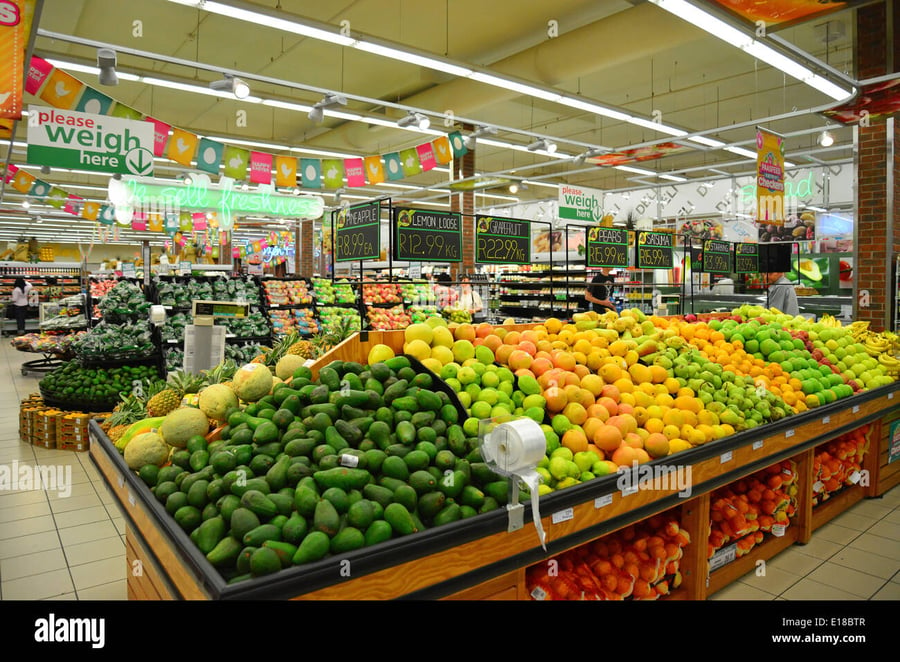
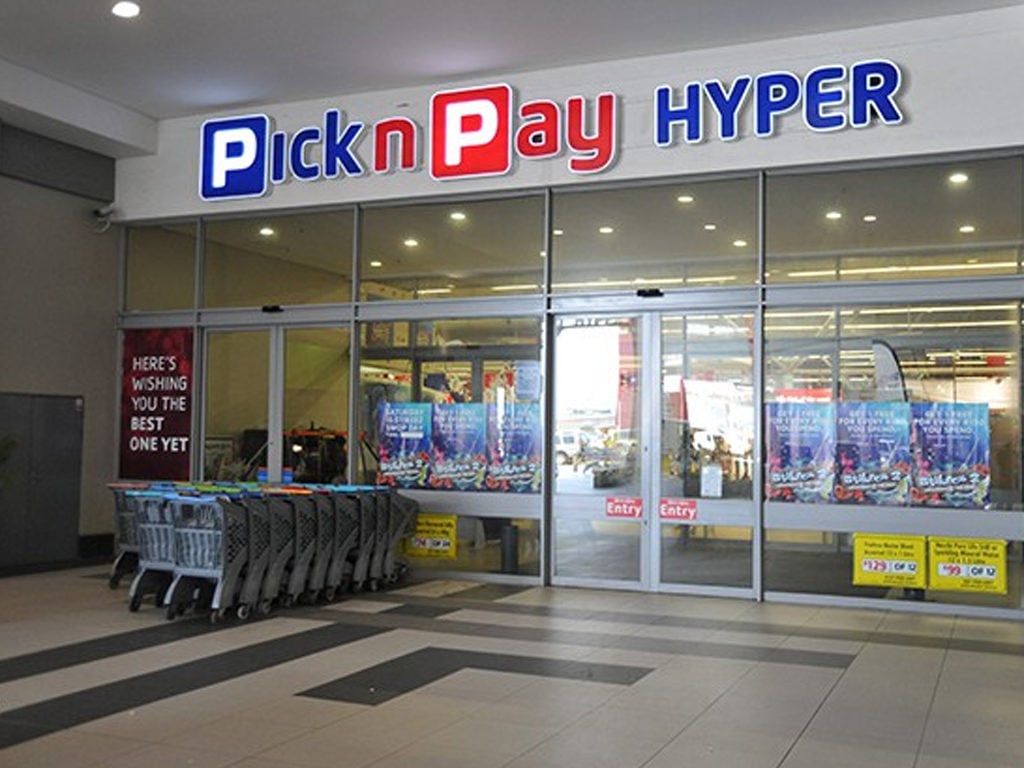
Tenant mix is limited to one primary store, Pick n Pay, resulting in low diversity but strong focus on groceries, where per capita spending reaches 12,000 ZAR annually. Occupancy is at 100% with no current vacancies, owned by Pick n Pay Stores Ltd. Sales performance averages 15,000 ZAR per square meter monthly, reflecting solid grocery sector performance amid Bloemfontein's retail landscape. Demographics include a median age of 28, household size of 3.3, 25% tertiary education, median income of 180,000 ZAR yearly, and 77.5% internet penetration, though unemployment at 32.5% poses spending constraints.
Leasing advantages include the anchor's draw for complementary retail, frequent promotions, high loyalty program use, and security via CCTV and guards. However, high e-commerce competition, retail crime rates, and category saturation in groceries present challenges. Bloemfontein's market shows stable occupancy around 90-95% in similar centers, with rent levels typically 150-250 ZAR per sqm monthly for non-anchor spaces, influenced by national trends in South African retail reports indicating resilient hypermarket formats despite economic pressures.
Interested in this property?
Choose how you'd like to proceed
Advertise at this property?
Reach high-intent shoppers across digital screens, atria, and experiential placements.
Hours of Operation
Hours
| Monday | 08:00 AM — 07:00 PM |
| Tuesday | 08:00 AM — 07:00 PM |
| Wednesday | 08:00 AM — 07:00 PM |
| Thursday | 08:00 AM — 07:00 PM |
| Friday | 08:00 AM — 07:00 PM |
| Saturday | 08:00 AM — 05:00 PM |
| Sunday | 09:00 AM — 03:00 PM |
Hours may vary on public holidays. Check with individual stores for specific holiday schedules.
Insights
Demographics and Catchment
The primary catchment area of 5 km encompasses 150,000 people with a median age of 28 years and household size of 3.3 persons. Median household income is 180,000 ZAR annually, supporting grocery spending of 12,000 ZAR per capita yearly, while apparel and electronics each see 1,700 ZAR. Tertiary education levels at 25% indicate a moderately skilled population, but unemployment at 32.5% limits discretionary spending. Population growth is 1.5% annually, with 77.5% internet penetration driving e-commerce threats. Cost of living index is 95 (national average 100), making the area affordable yet constraining premium retail viability. This profile favors value-oriented grocery and essential retail leasing, though high unemployment risks lower footfall during economic downturns.
Competition and Market Risks
Bloemfontein's retail market features intense grocery competition from chains like Shoprite and Spar, with competitor density at 3 similar outlets per 10 km radius. National reports highlight market saturation in hypermarkets, where Pick n Pay holds significant share but faces e-commerce growth and click-and-collect adoption. Retail crime rates are high, potentially increasing operational costs through enhanced security needs. Conversion rates at 60% suggest moderate sales potential, but weak categories like apparel may underperform due to demographic preferences for essentials. Aging infrastructure from 1995 build could require maintenance investments, while broader market factors include South Africa's 5-7% retail vacancy rates in secondary cities, pressuring rents downward amid post-pandemic recovery challenges.
Accessibility and Operational Quality
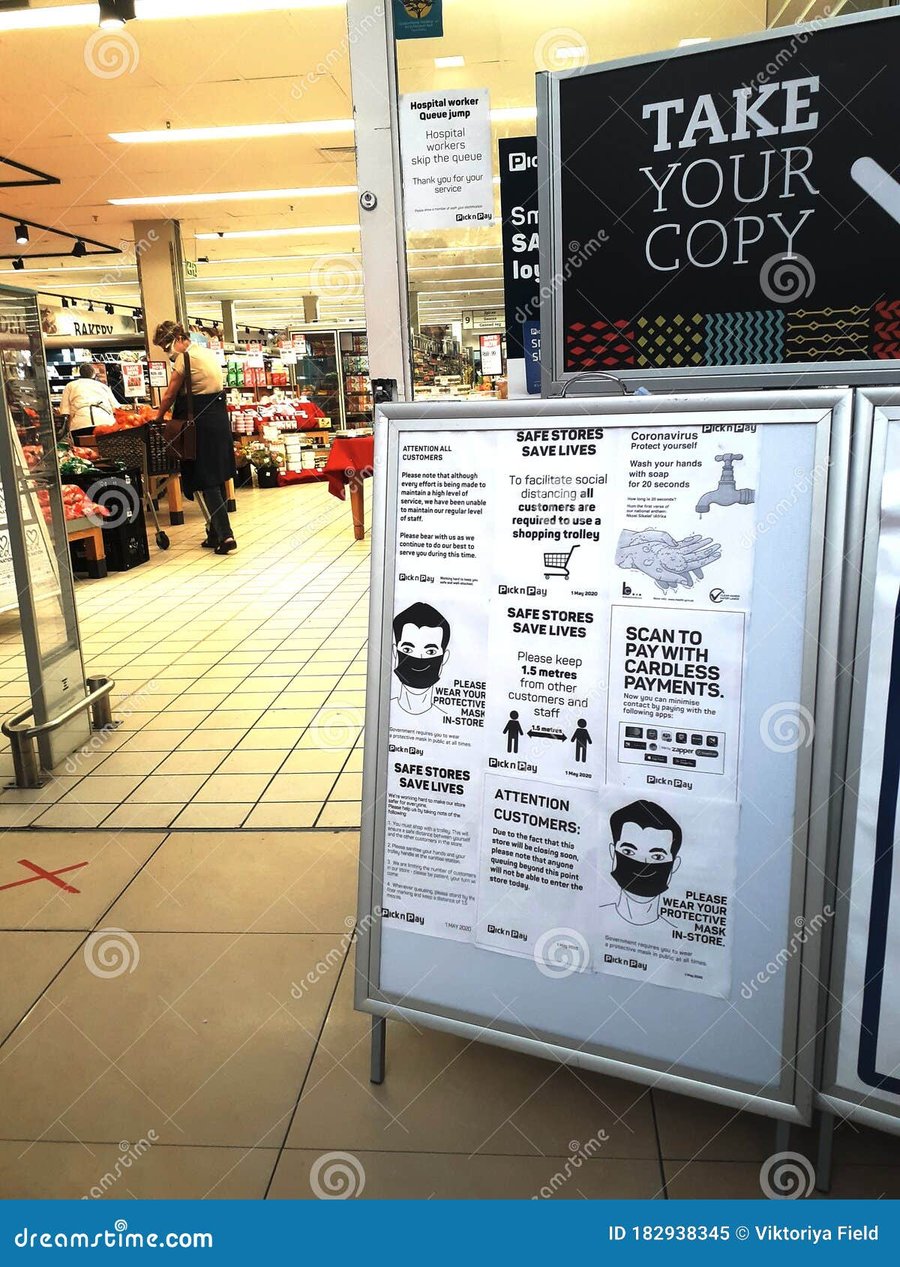
Direct proximity to main roads enhances vehicle access, with 400 parking spaces supporting the 750,000 annual visitors. Public transport is moderate, limiting pedestrian draw, while security includes CCTV and guards, alongside digital signage for promotions. Operational strengths lie in the anchor's high sales of 15,000 ZAR per sqm monthly and frequent events boosting loyalty penetration. However, low tenant diversity restricts synergistic mix, and no expansion plans limit growth. Lease terms offer flexibility in similar properties, with rents around 150-250 ZAR per sqm monthly, but high crime and e-commerce pose risks to footfall stability. Overall, the site's established position aids reliable traffic, though infrastructure updates may be needed for modern retail standards.
Building Details
Detailed Market Analytics
City Snapshot
Bloemfontein
Comprehensive market intelligence for retail expansion in this city

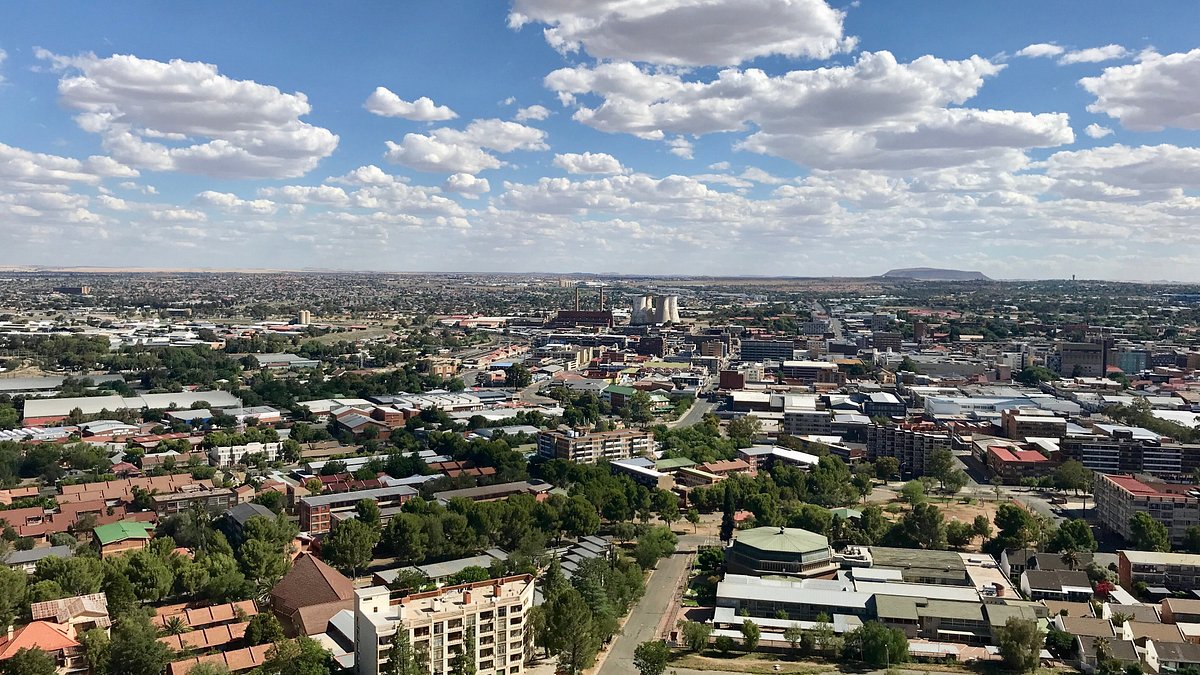
Other Retail Destinations in Bloemfontein
Discover more shopping centers in Bloemfontein.


Popular in South Africa
Top retail destinations across South Africa.




Interested in this property?
Choose how you'd like to proceed
Advertise at this property?
Reach high-intent shoppers across digital screens, atria, and experiential placements.
City Snapshot
Bloemfontein
Comprehensive market intelligence for retail expansion in this city