Brand Fit Snapshot
Best for:
Not ideal if:
Similar properties you might like:
Quick assessment - takes 30 seconds
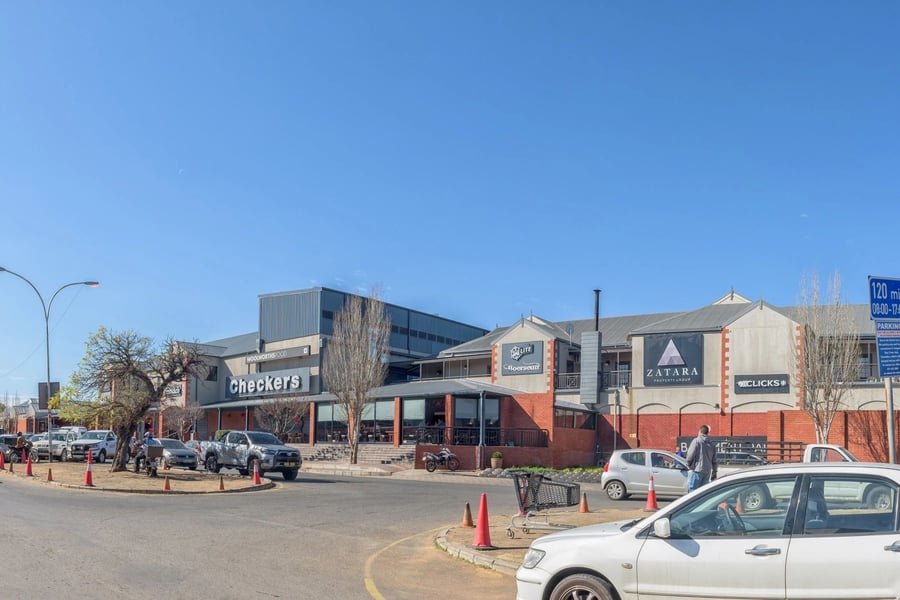
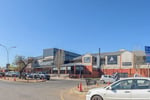
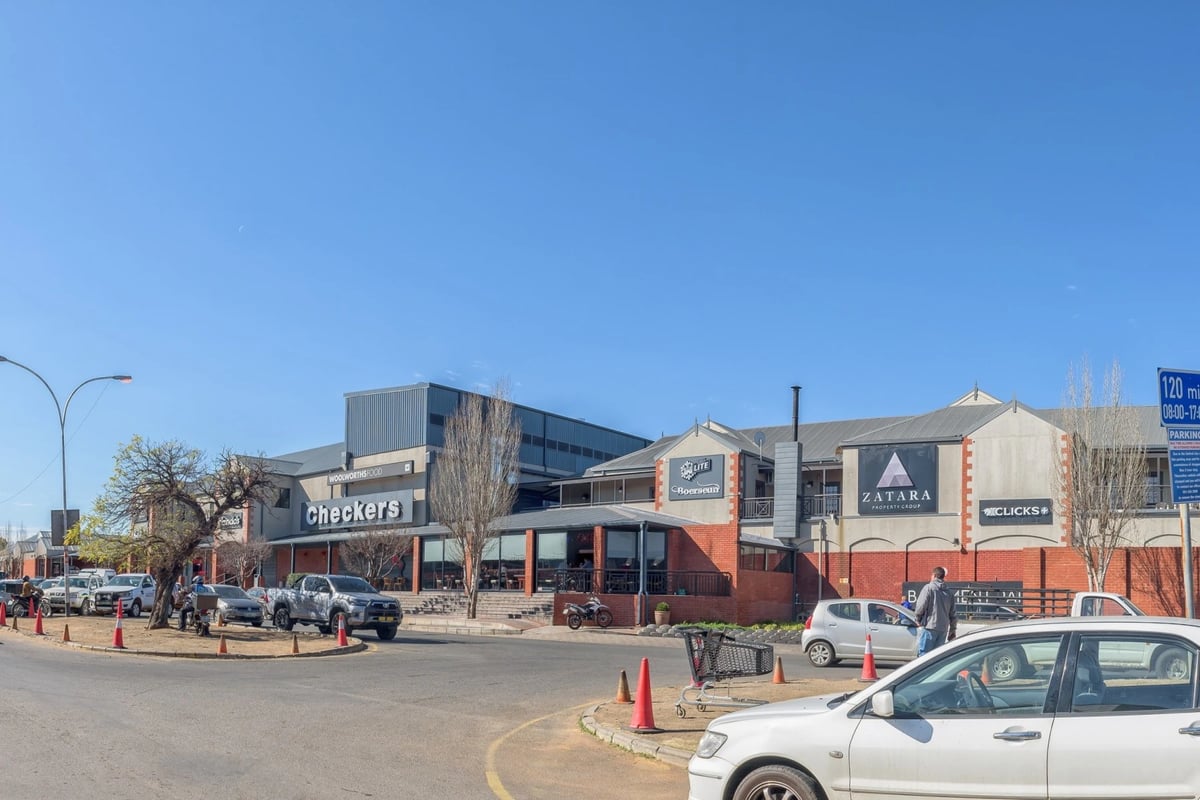
Bloemgate Shopping Centre is a neighborhood retail property located at 81 Corner Nelson Mandela Drive and DF Malherbe Avenue in the Brandwag suburb of Bloemfontein, Free State, South Africa. Situated in the Park West area, it serves as a convenience-oriented center for local residents in a mixed residential zone. The center offers gross leasable area units ranging from 160 m² to 360 m², with current rental rates starting at R156 per m², reflecting typical pricing for smaller suburban retail spaces in the region.
As per commercial real estate listings from Broll Property Group, which manages the property, available units include features like toilets, kitchens, storerooms, delivery areas, and offices, indicating suitability for small to medium retail operations such as food services, personal care, or specialty stores. The tenant mix is geared toward everyday essentials, likely including anchor tenants in grocery or pharmacy categories, though specific occupants are not publicly detailed; this aligns with South African neighborhood centers that prioritize high-frequency, low-value purchases to drive consistent footfall.
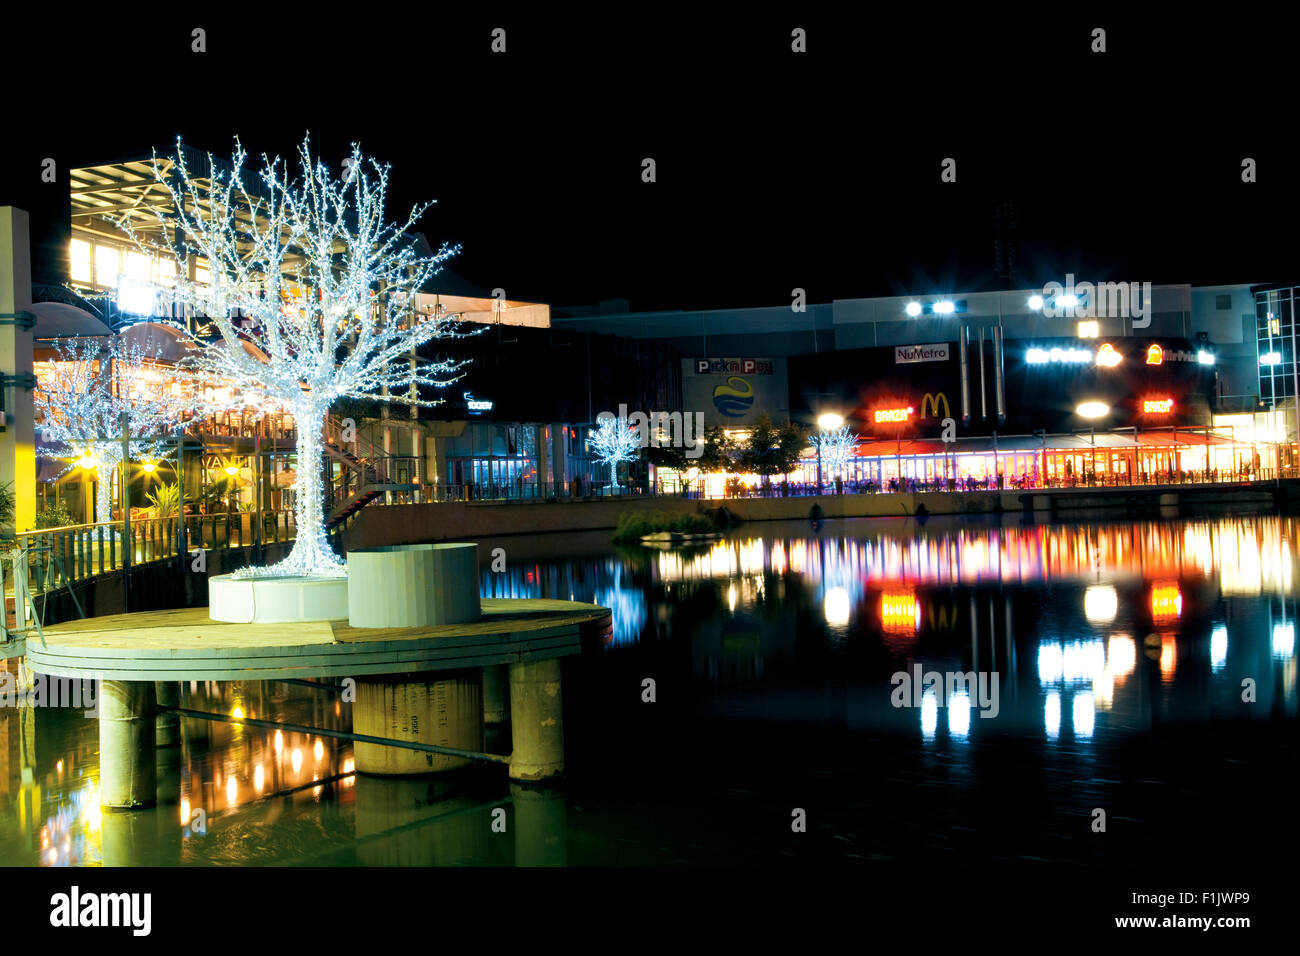
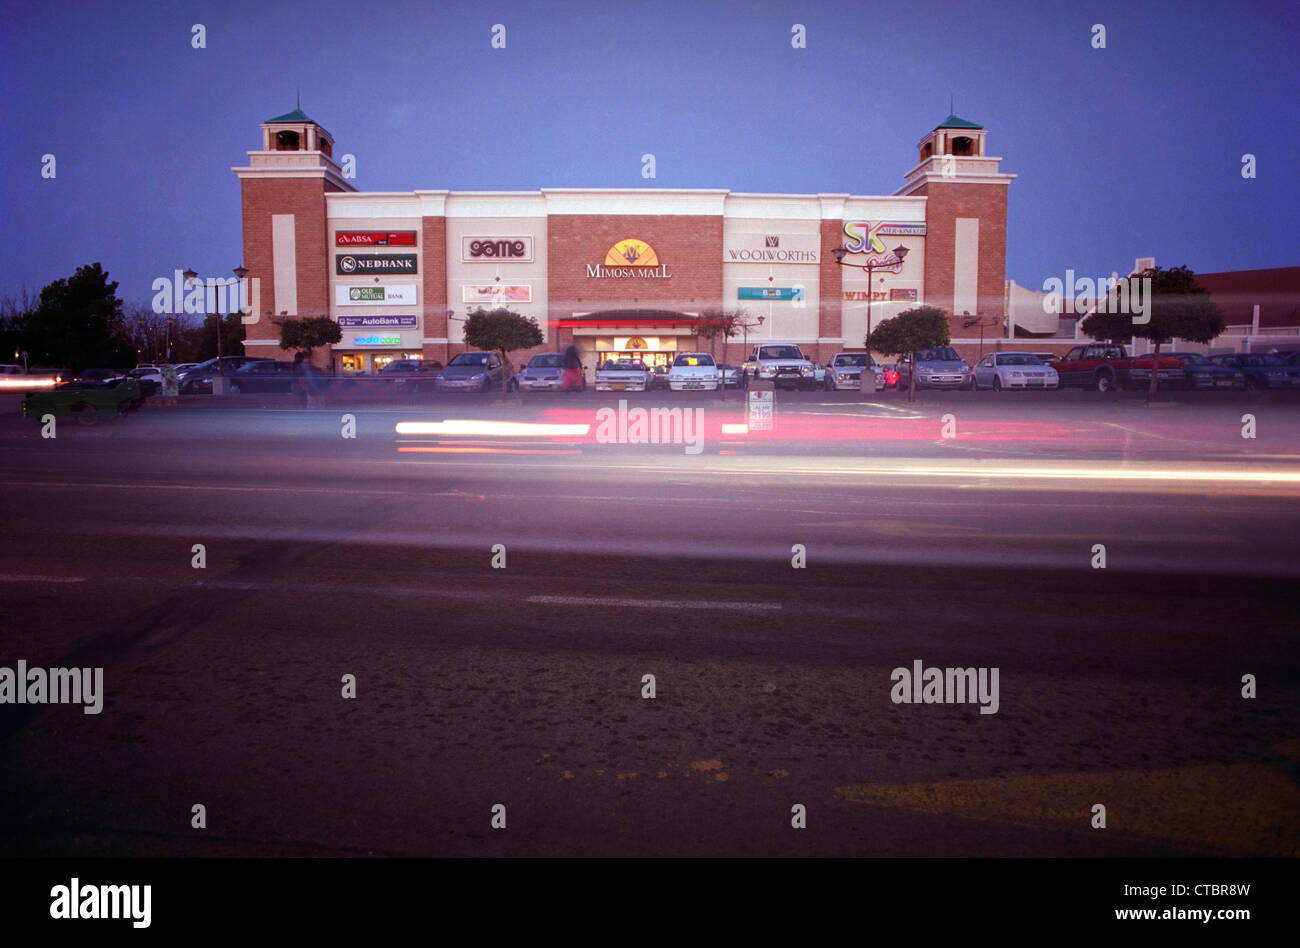
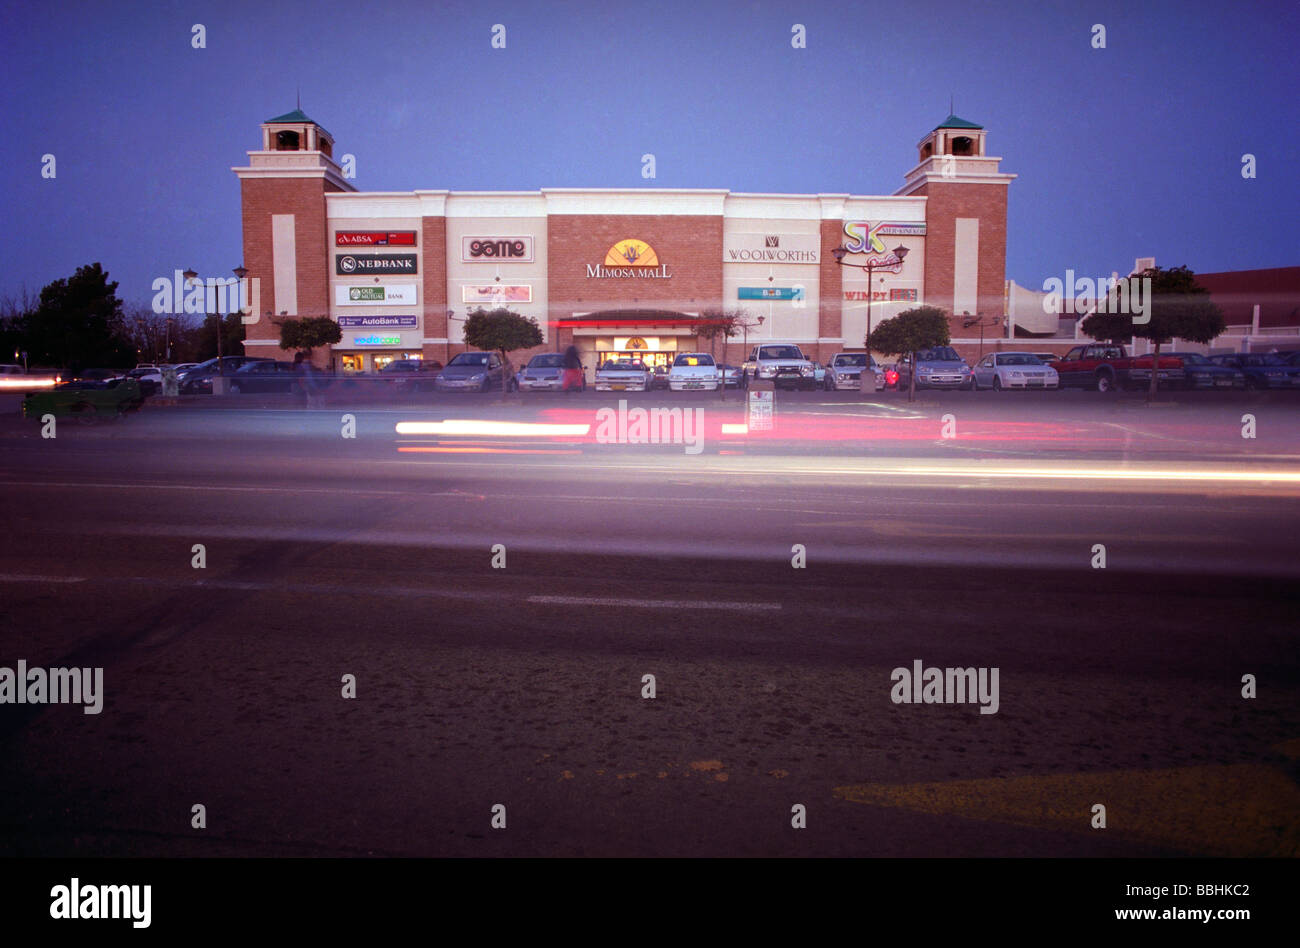
Bloemfontein's retail market, according to 2023-2024 reports from property funds like Vukile and general market analyses, shows stable performance with average occupancy rates around 94-96% for similar centers, supported by the city's growing population of over 500,000 and its role as the judicial capital. However, the market faces pressures from e-commerce growth and competition from larger regional malls like Mimosa Mall and Loch Logan Waterfront, which boast higher footfall of over 10 million annual visitors.
Bloemgate's market position is as a secondary, accessible venue with advantages in proximity to residential areas, reducing travel barriers for middle-income households.
Demographic profile of Brandwag includes a population density of 2,730 per km², with 66% Black African, 25% White, and 6% Coloured residents, speaking primarily Afrikaans (31%), Sesotho (22%), and English (18%); average household income in the broader Bloemfontein metro is estimated at R15,000-R25,000 monthly, supporting convenience retail but limiting luxury spending.
Leasing advantages include flexible unit sizes and lower rent compared to prime CBD locations (R200+ per m²), with potential for stable tenancy due to local demand. Drawbacks encompass limited visibility, potential aging infrastructure in older suburban centers, and vulnerability to economic slowdowns affecting disposable income in a city with 35% unemployment rates per Stats SA data.
Overall, it suits retailers targeting everyday needs in a stable but competitive suburban environment, with risks from market saturation in Free State retail (over 20 centers citywide).
Interested in this property?
Choose how you'd like to proceed
Advertise at this property?
Reach high-intent shoppers across digital screens, atria, and experiential placements.
Hours of Operation
Hours
| Monday | 09:00 AM — 06:00 PM |
| Tuesday | 09:00 AM — 06:00 PM |
| Wednesday | 09:00 AM — 06:00 PM |
| Thursday | 09:00 AM — 06:00 PM |
| Friday | 09:00 AM — 06:00 PM |
| Saturday | 09:00 AM — 06:00 PM |
| Sunday | 09:00 AM — 01:00 PM |
Hours may vary on public holidays. Check with individual stores for specific holiday schedules.
Insights
Demographics and Catchment
Brandwag suburb has a 2011 census population of 4,075 across 1.49 km², part of Bloemfontein's 500,000+ metro area with middle-income households averaging R15,000-R25,000 monthly. Diverse racial makeup (66% Black African, 25% White) and languages (Afrikaans 31%, Sesotho 22%) indicate a broad consumer base for convenience goods. Catchment likely extends to 20,000-30,000 residents within 5 km, supporting daily footfall but sensitive to local economic factors like 35% unemployment, per Stats SA 2023 data, which could impact spending on non-essentials.
Competition and Market Position
Bloemgate operates as a neighborhood center amid competition from larger venues like Mimosa Mall (GLA 35,000 m², 95% occupancy) and Loch Logan Waterfront (10M+ annual visitors). Free State retail reports note 94-96% average occupancy for suburban sites, but Bloemgate's smaller scale (estimated GLA <10,000 m²) limits draw, with risks from 20+ centers in Bloemfontein causing saturation in categories like fashion and food. Strengths include low competition for hyper-local services, though e-commerce growth (15% YoY per 2024 retail insights) poses broader threats to physical footfall.
Lease Terms and Operational Quality
Rental rates start at R156 per m², below CBD averages (R200-R300), with units offering practical amenities like delivery access and storerooms, suitable for SMEs. Occupancy data is unavailable specifically, but regional trends suggest 90%+ for similar properties per Vukile 2024 reports. Operational challenges may include aging infrastructure common in 1990s-era centers, potential access issues via Nelson Mandela Drive during peak hours, and maintenance reliant on Broll management. Advantages: flexible leases, proximity to residential zones enhancing accessibility; risks: escalation clauses tied to CPI (5-7% annually) and vacancy periods if tenant mix weakens in saturated markets.
Building Details
Detailed Market Analytics
City Snapshot
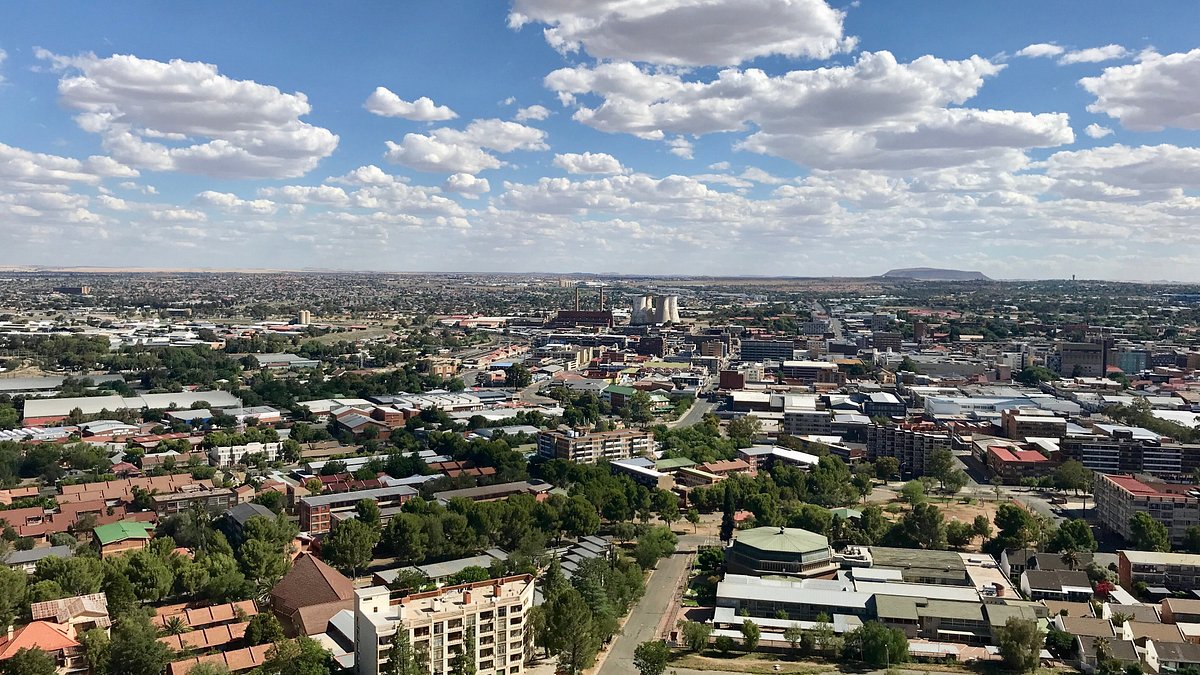
Bloemfontein
Comprehensive market intelligence for retail expansion in this city

Other Retail Destinations in Bloemfontein
Discover more shopping centers in Bloemfontein.


Popular in South Africa
Top retail destinations across South Africa.




Interested in this property?
Choose how you'd like to proceed
Advertise at this property?
Reach high-intent shoppers across digital screens, atria, and experiential placements.
City Snapshot
Bloemfontein
Comprehensive market intelligence for retail expansion in this city