







Brand Fit Snapshot
Best for:
Not ideal if:
Similar properties you might like:
Quick assessment - takes 30 seconds
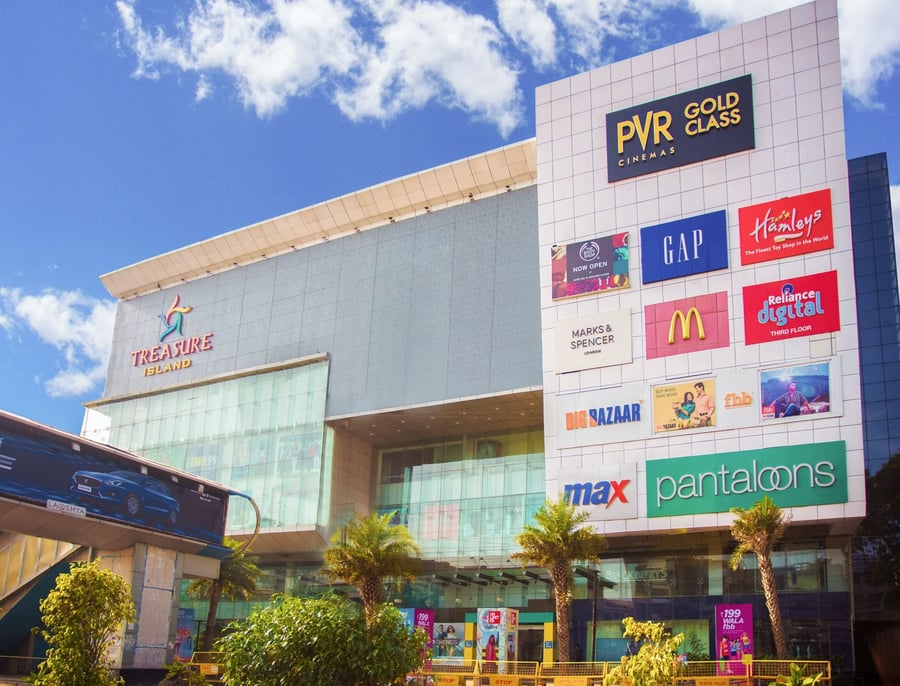
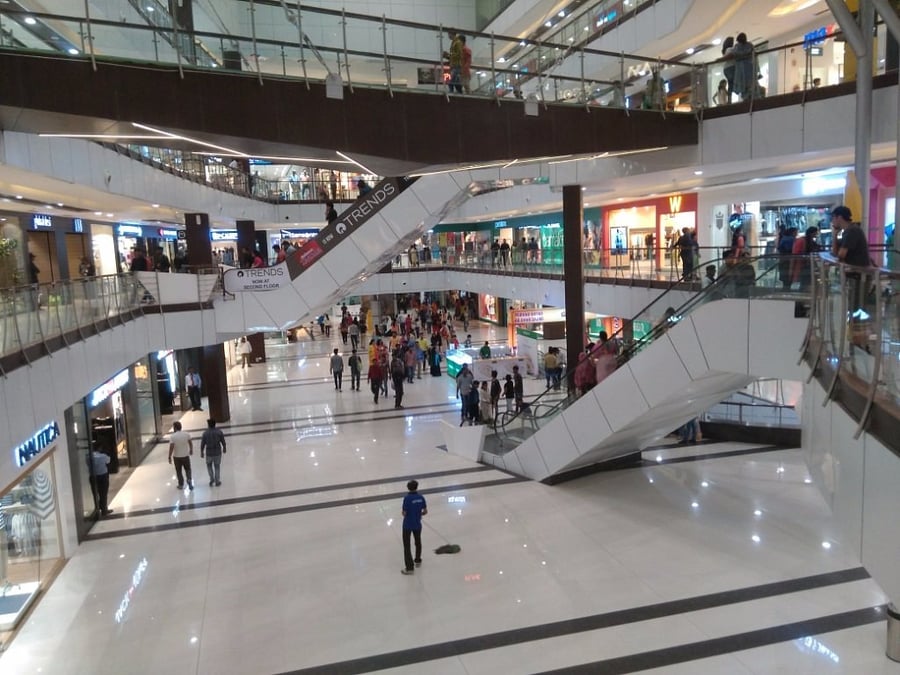
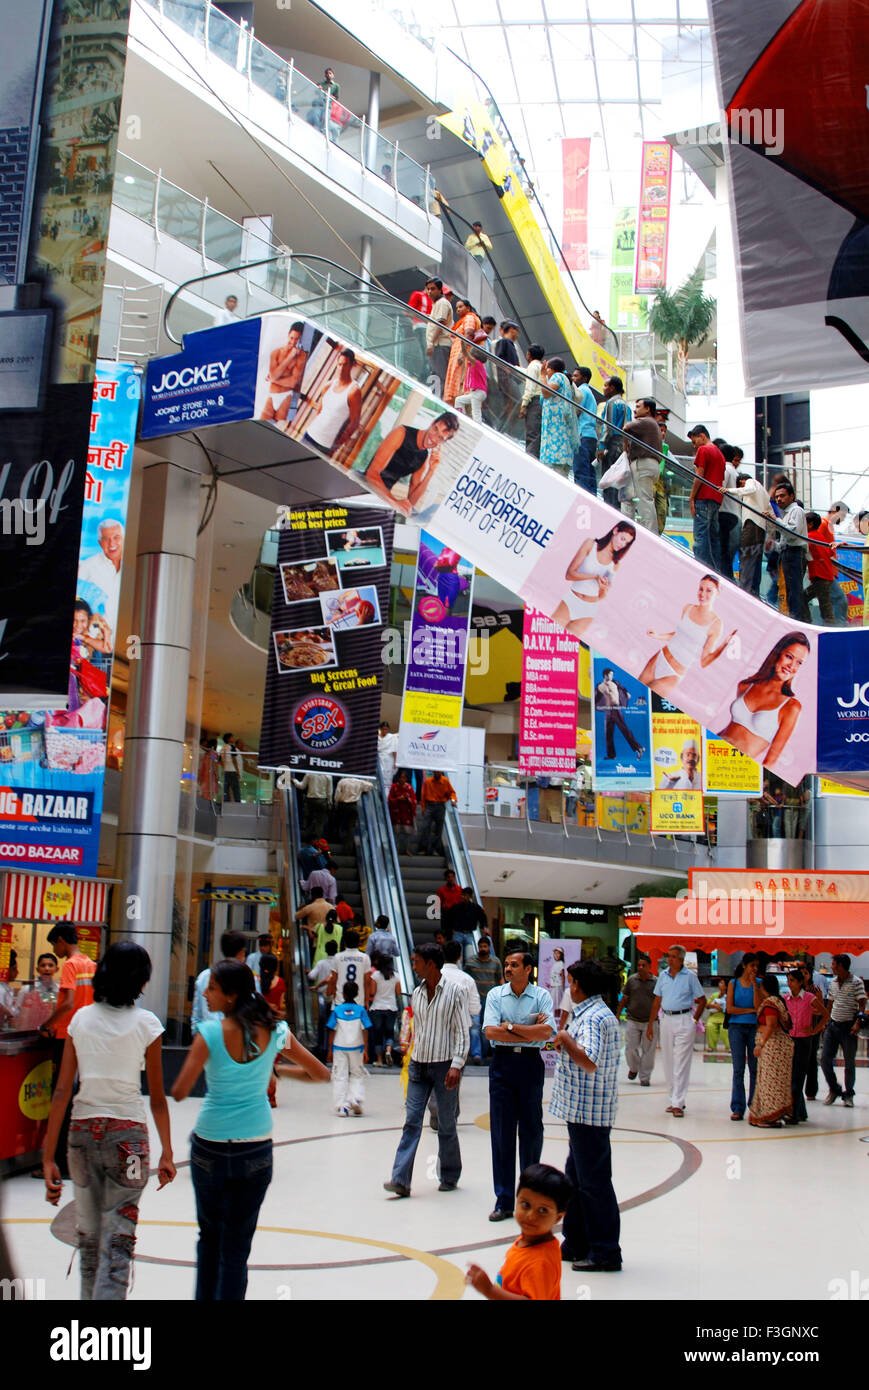
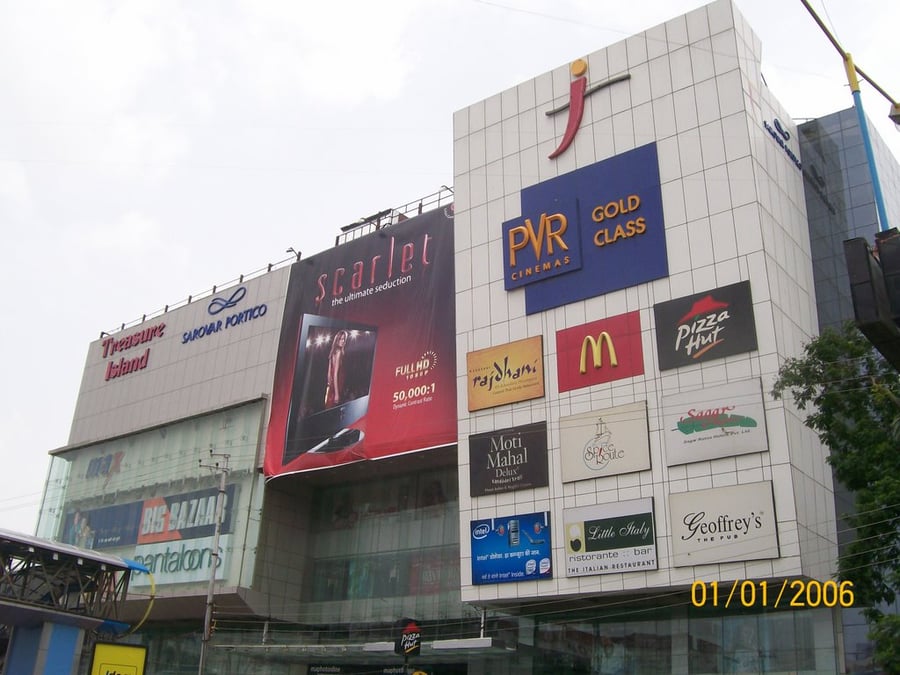
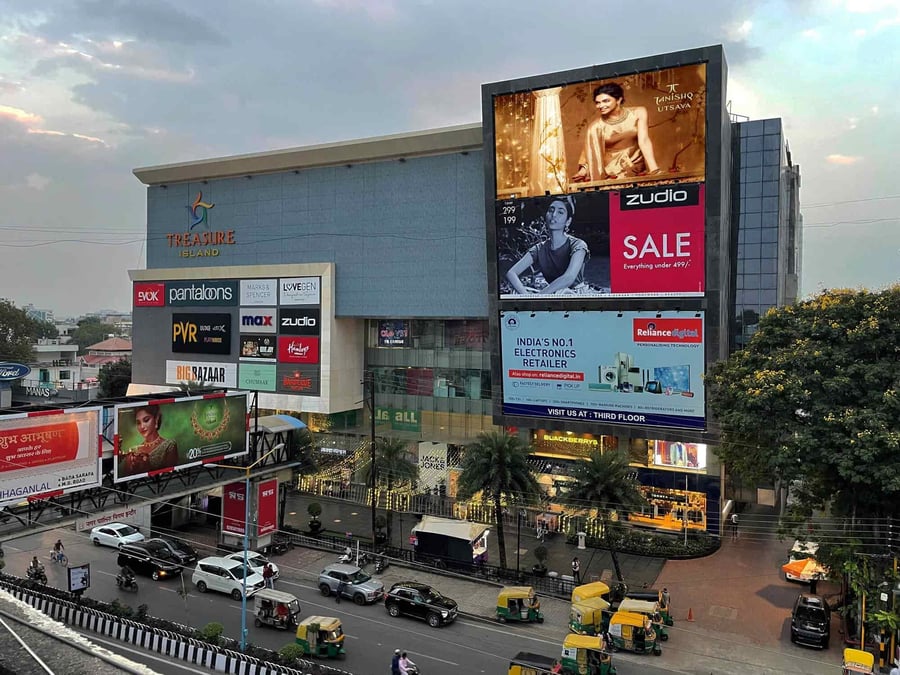
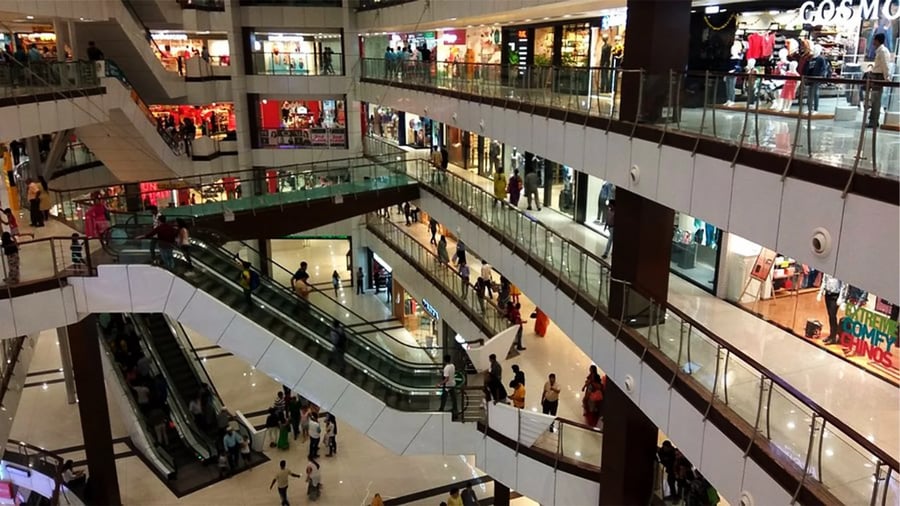
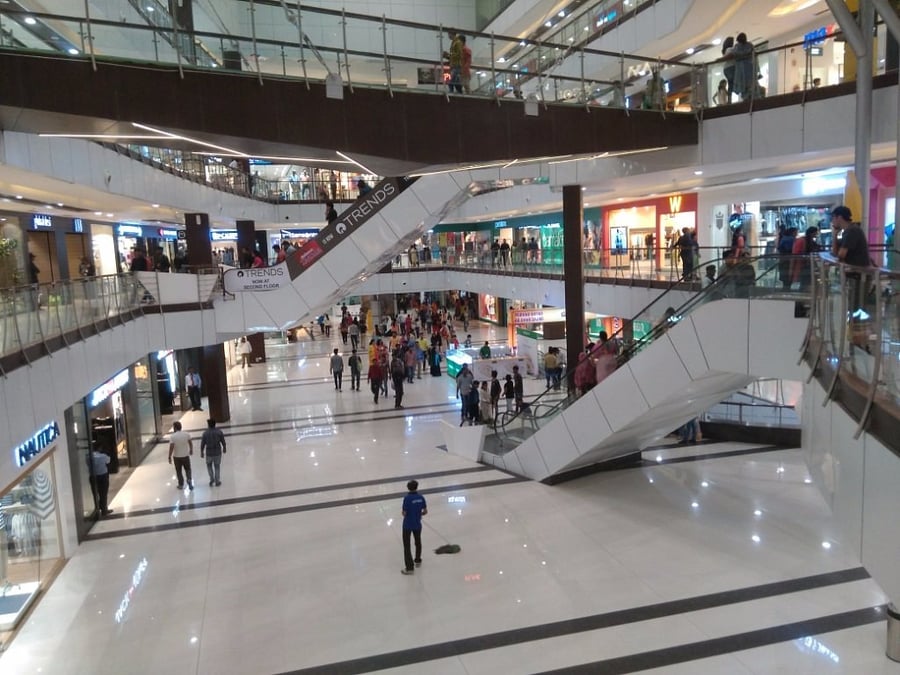
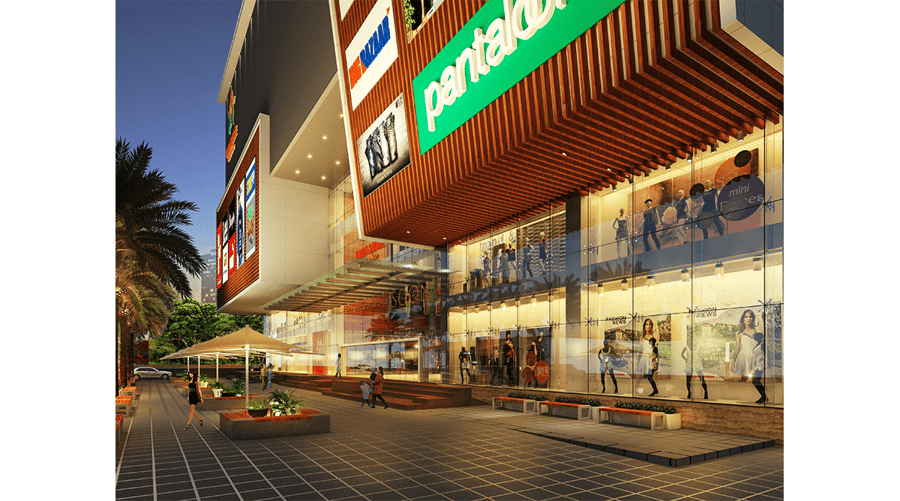
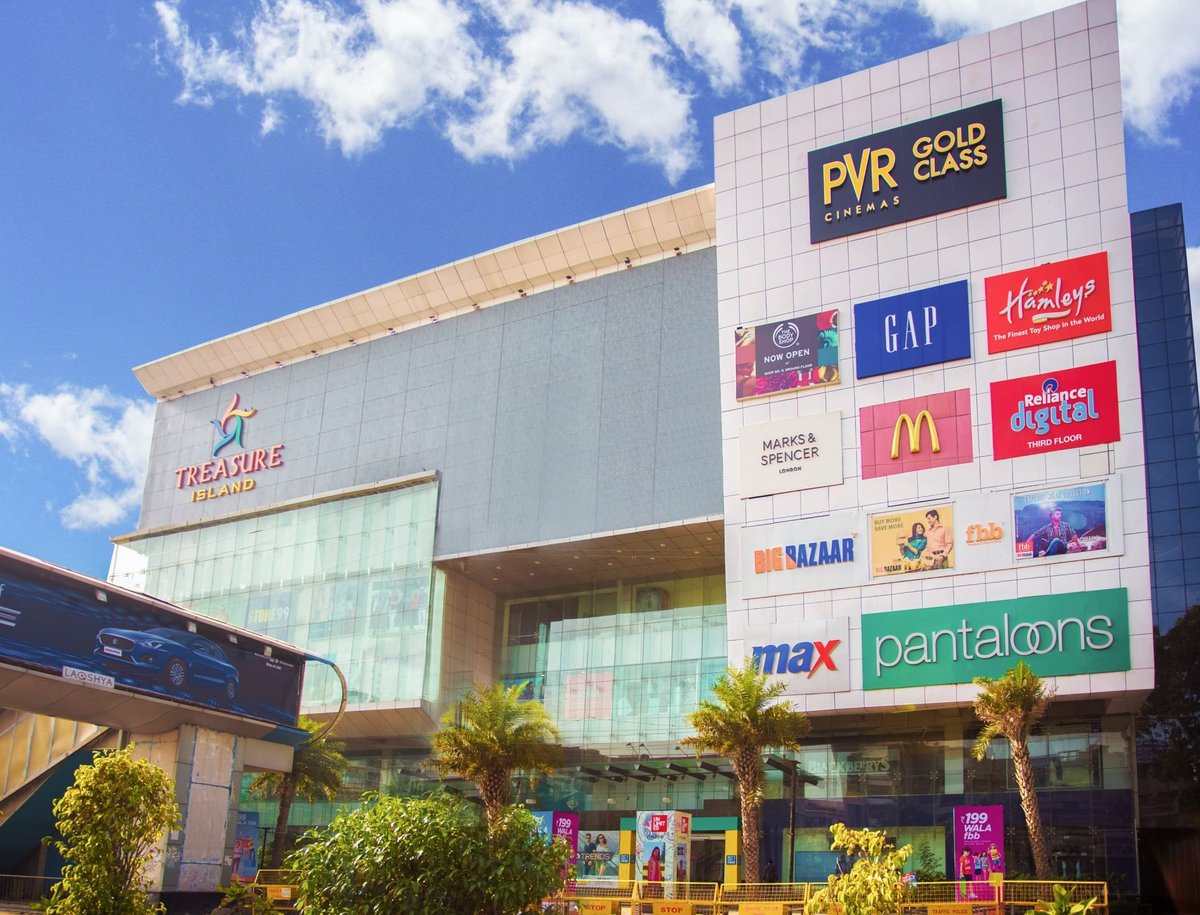
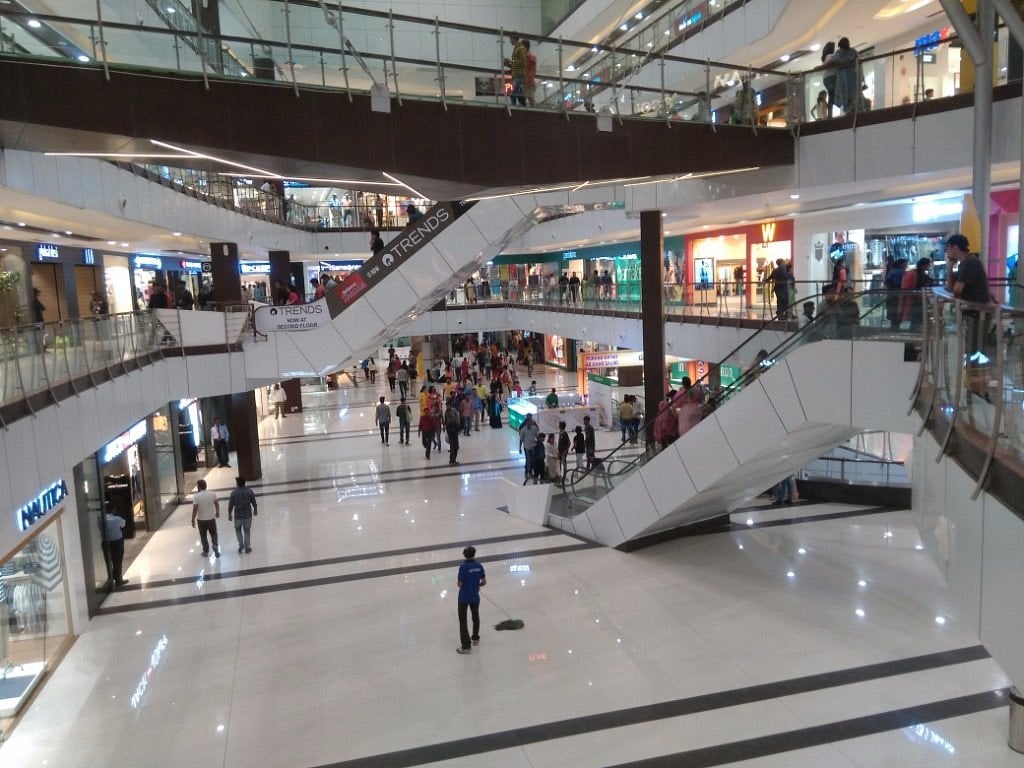
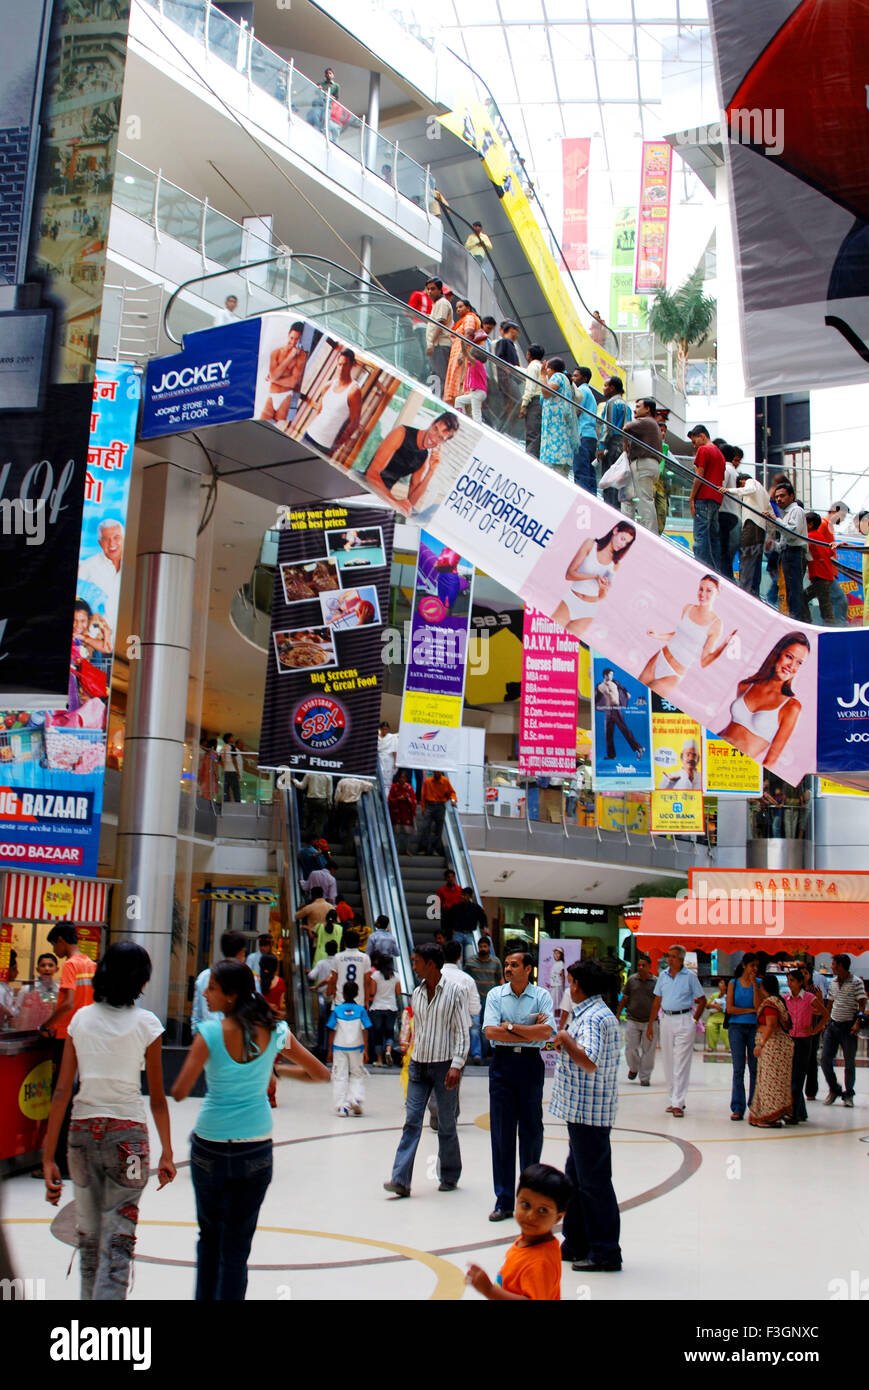
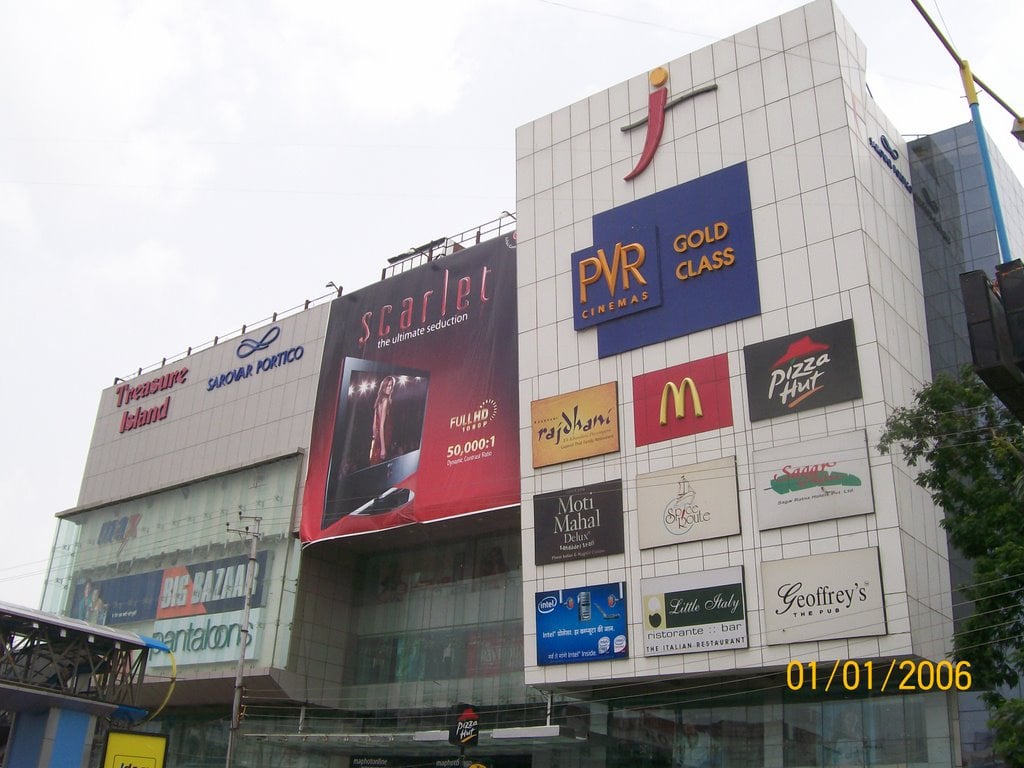
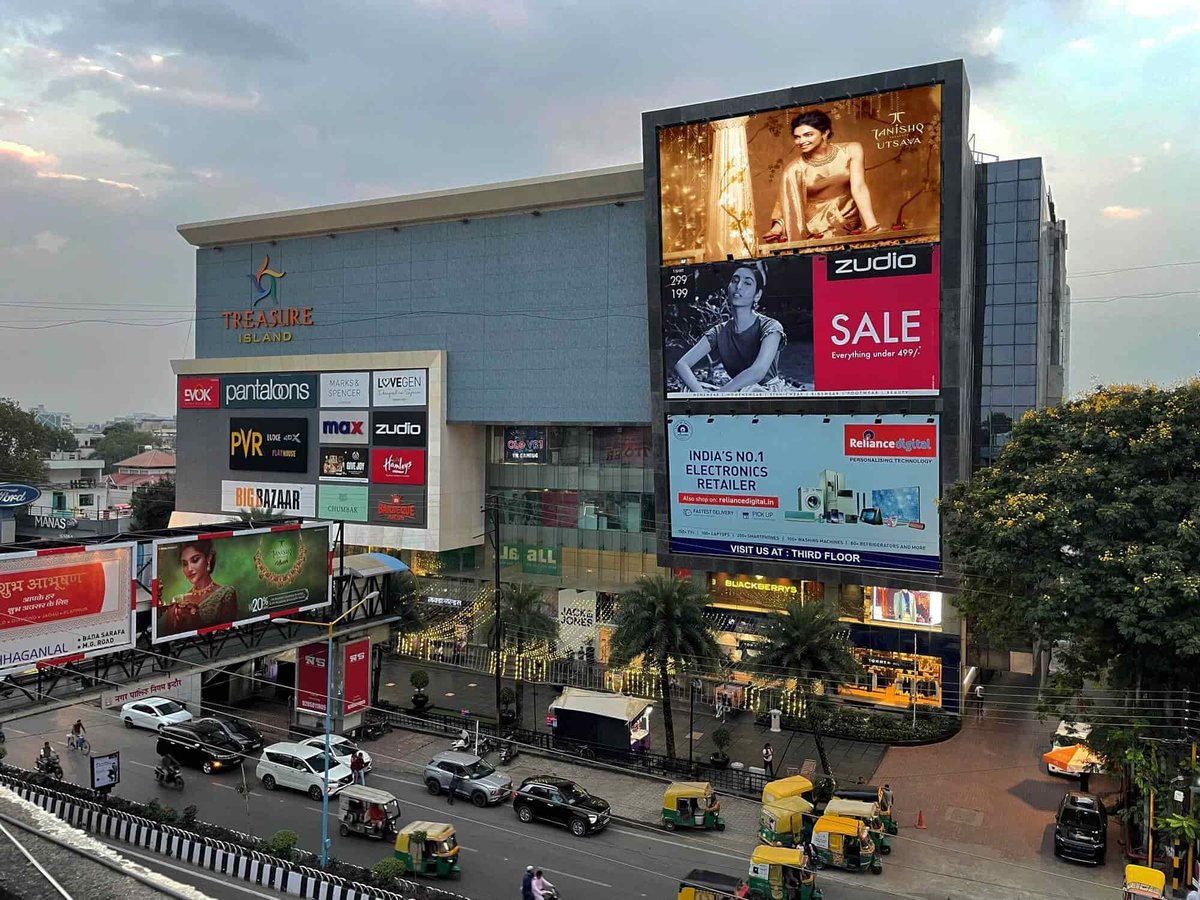
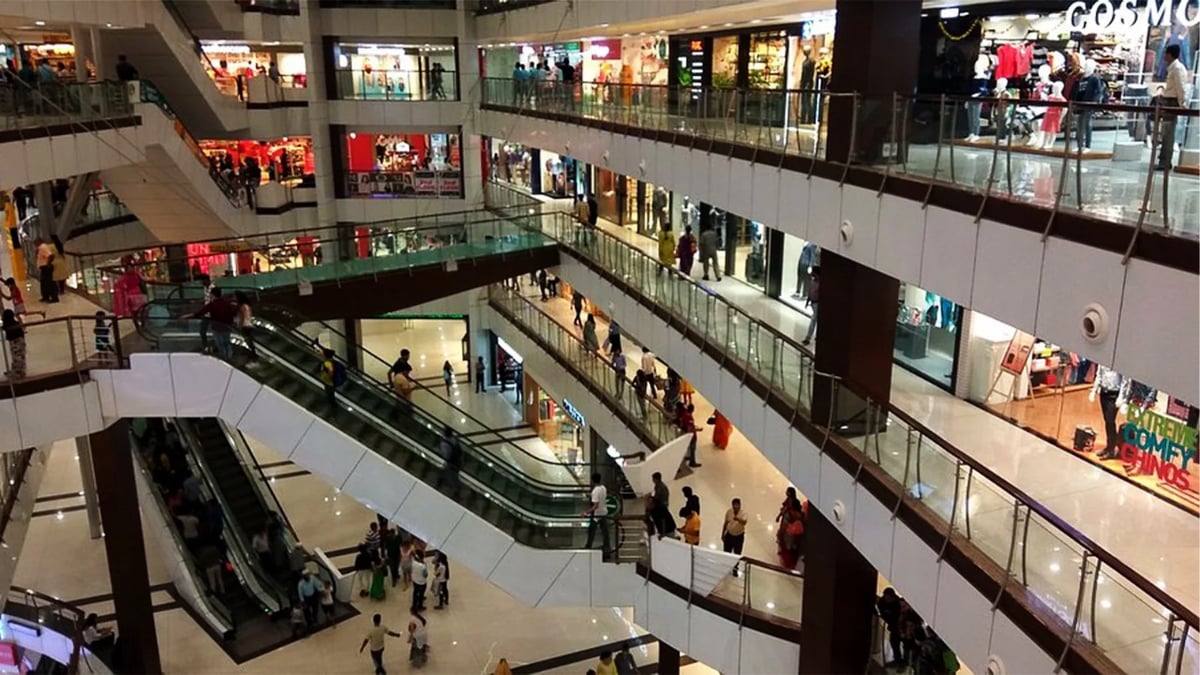
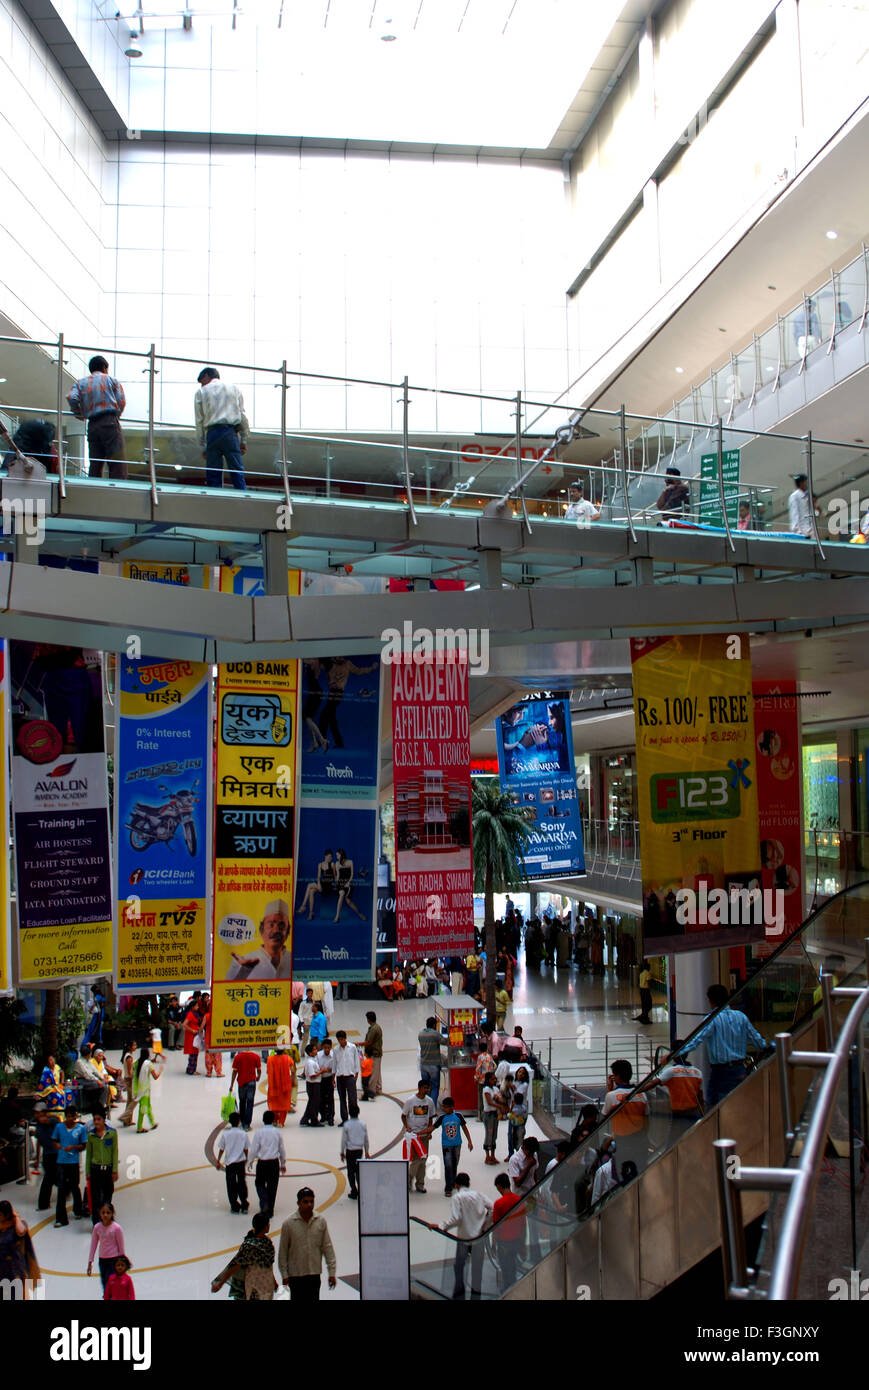
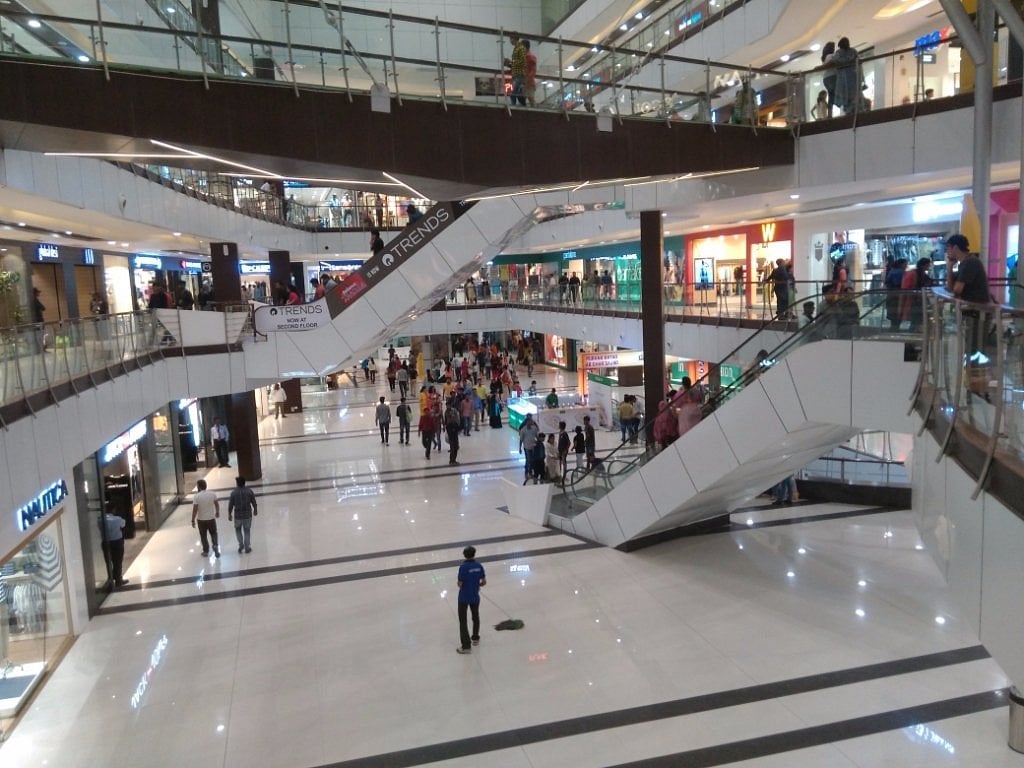
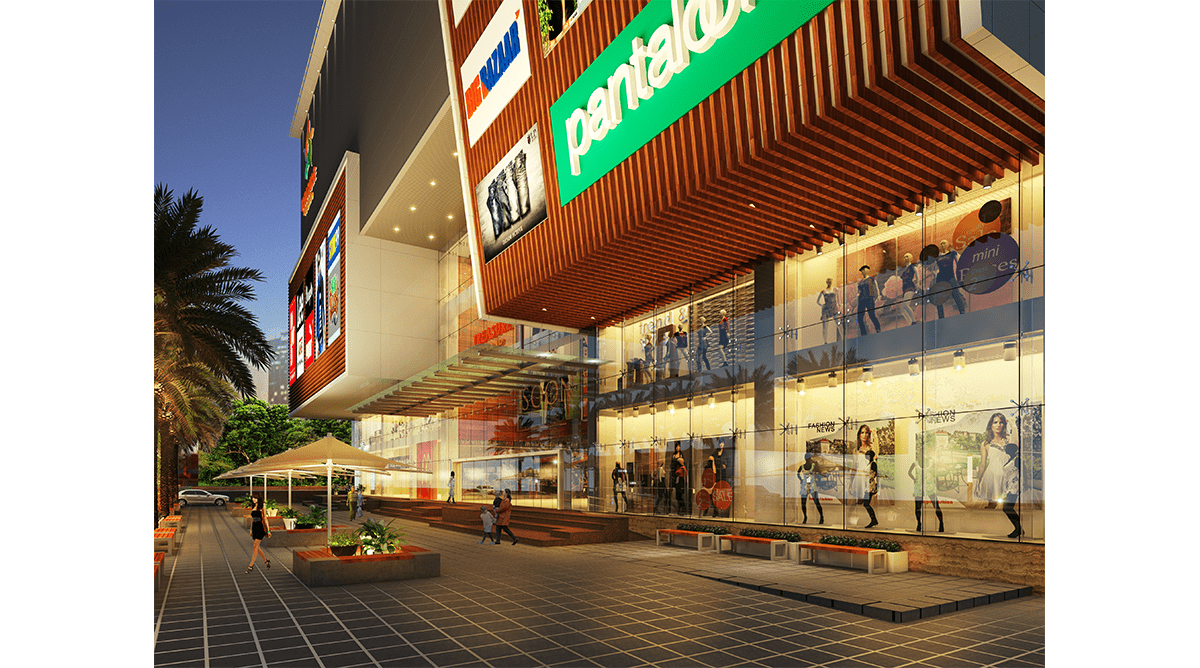
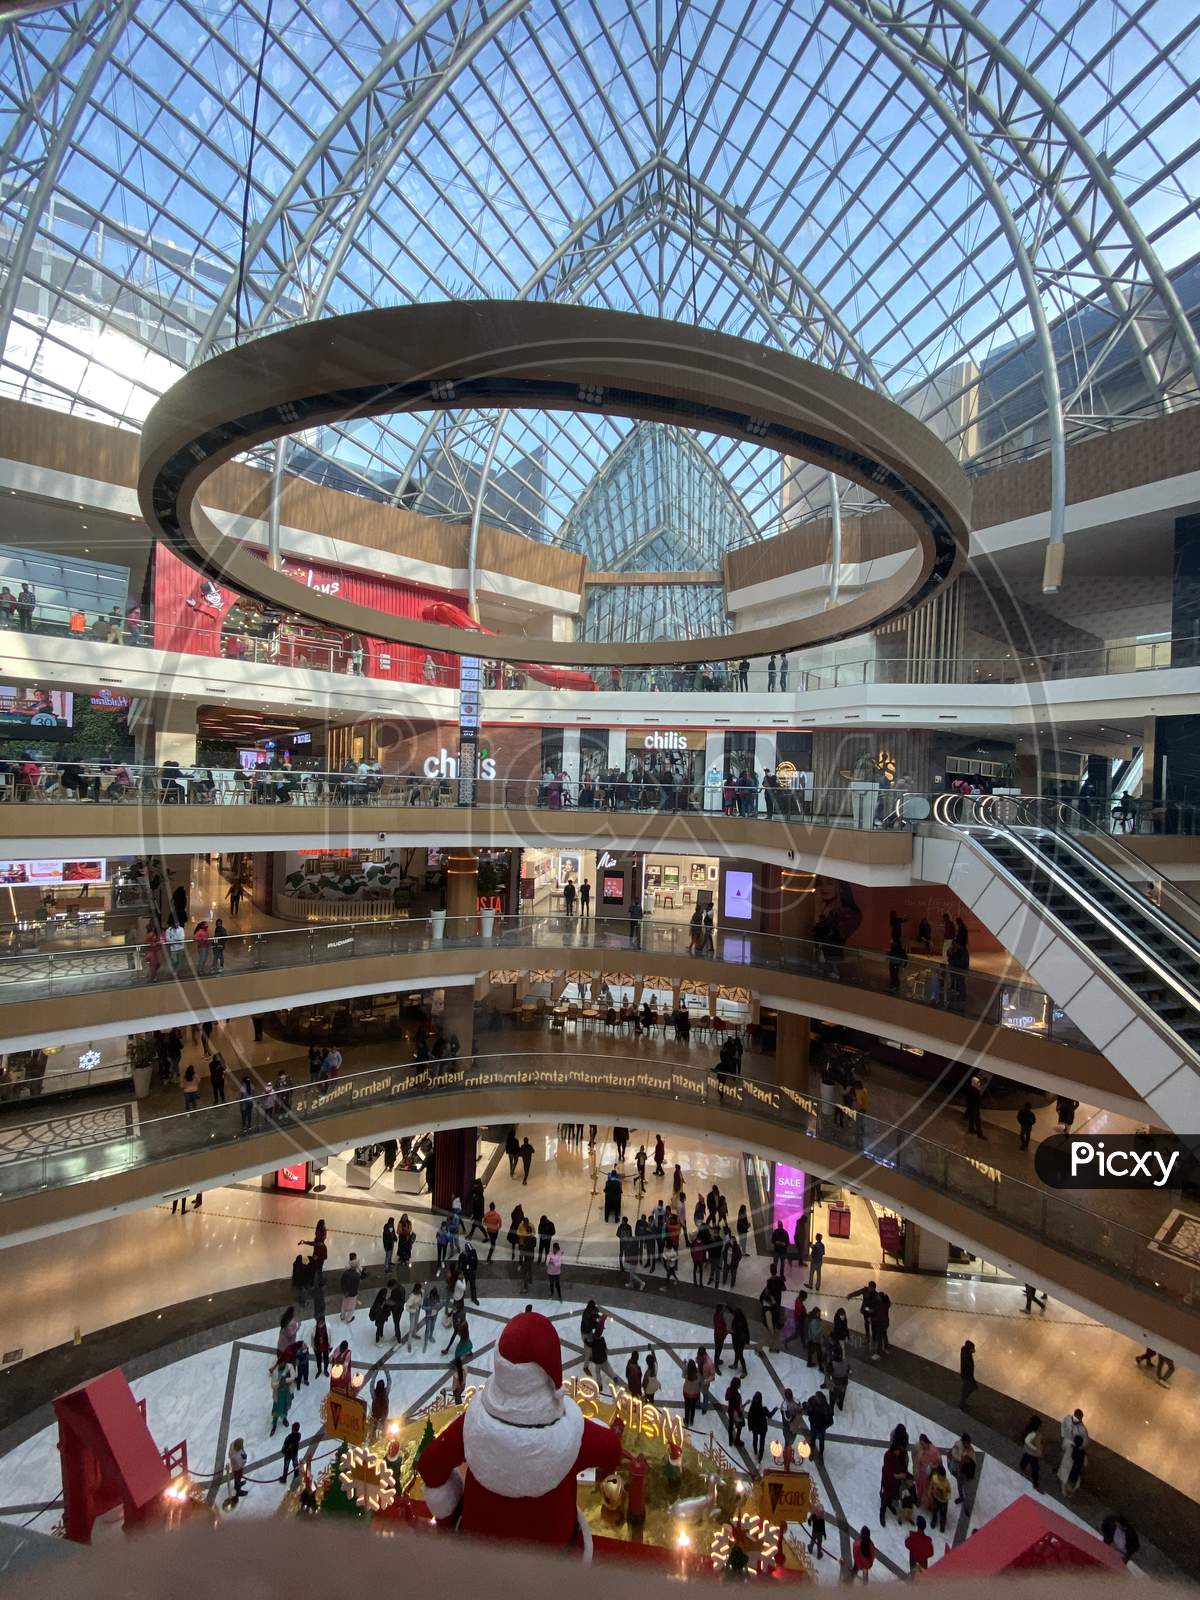
Nexus Treasure Island Mall, located at 11 MG Road in Indore, opened in 2005 as the citys first shopping mall, spanning 37160 square meters of gross leasable area across five levels and owned by Nexus Select Trust. It features 115 plus tenants with a diverse mix including anchors such as PVR Cinemas multiplex, Lifestyle, Max Fashion, and Pantaloons, alongside premium apparel brands like Allen Solly, Levis, and Jack and Jones, accessories from Lavie and Jockey, and a food court for entertainment.
The tenant composition emphasizes fashion and lifestyle at 40 percent of space, with entertainment driving dwell times of 120 minutes. Occupancy stands at 95 percent, reflecting robust leasing demand in Indores tier-two retail market, where the metro population exceeds 3.2 million with a young demographic averaging 28 years old and median household income of 350000 INR annually. Annual footfall ranges from 4 to 11 million visitors, though recent last twelve months data shows 3 million with a 20 percent year-over-year decline due to post-pandemic shifts and economic pressures.
Market position as an established central hub benefits from primary catchment in affluent areas like South Tukoganj and Palasia within 5 km, contributing 70 percent of visitors, and secondary areas up to 15 km.
Leasing advantages include competitive rents of 150 to 200 INR per square foot per month for prime spaces, positive re-leasing spreads of 10 to 15 percent, and flexible three- to five-year terms often incorporating revenue sharing. Sales per square meter reach 45000 INR annually with an 18 percent conversion rate.
Accessibility is supported by 1200 parking spaces and proximity to main roads, though MG Road congestion poses risks.
Operational quality is solid with security measures and 50 annual promotional events, but aging infrastructure from 20 years of operation necessitates capital expenditure for upgrades. Competition from newer malls like Nexus Indore Central and C21, combined with high e-commerce penetration at 65 percent, contributes to market saturation in apparel categories and potential footfall volatility of 5 to 10 percent in off-peak seasons.
Indores retail sector shows 2.5 percent population growth and 8 percent projected foot traffic increase, yet faces challenges from 6.8 percent unemployment and discretionary spending dips amid tier-two slowdowns with rising 5 percent vacancy rates across properties.
Interested in this property?
Choose how you'd like to proceed
Advertise at this property?
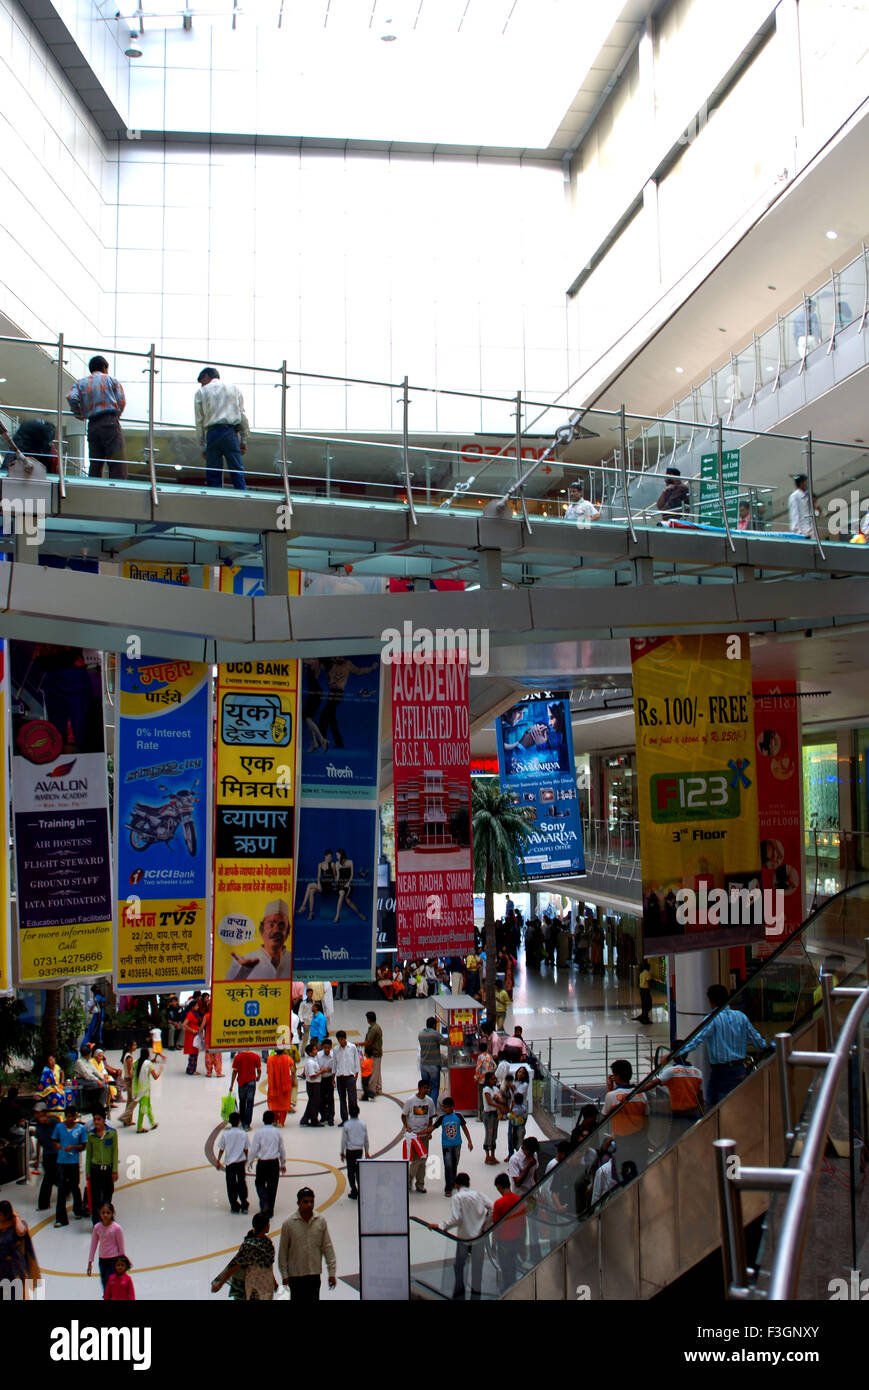
Reach high-intent shoppers across digital screens, atria, and experiential placements.
Hours of Operation
Hours
| Monday | 11:00 AM — 10:00 PM |
| Tuesday | 11:00 AM — 10:00 PM |
| Wednesday | 11:00 AM — 10:00 PM |
| Thursday | 11:00 AM — 10:00 PM |
| Friday | 11:00 AM — 10:00 PM |
| Saturday | 11:00 AM — 10:00 PM |
| Sunday | 11:00 AM — 10:00 PM |
Hours may vary on public holidays. Check with individual stores for specific holiday schedules.
Insights
Demographic Profile
The primary catchment area encompasses affluent neighborhoods such as South Tukoganj, Saket, and Palasia within a 5 km radius, serving a population of approximately 1200000 with average household incomes of 10 to 15 lakh INR, accounting for 70 percent of visitors. Secondary catchment extends to Vijay Nagar, Rau, and Rajendra Nagar up to 15 km. Indores broader metro area of 3.2 million residents features a youthful profile with 60 percent under 35 years, median age of 28, 85 percent literacy rate, and 25 percent tertiary education attainment. Per capita income stands at 250000 INR annually, supporting retail spending of 25000 INR per person yearly, including 8000 INR on apparel. Household size averages 4.2 persons with 2.5 percent population growth. This demographic favors mid-premium fashion and entertainment, though 65 percent internet penetration drives 30 percent click-and-collect adoption and heightens e-commerce competition, potentially reducing physical store traffic by 15 percent in discretionary categories amid economic slowdowns affecting middle-class disposable income.
Competitive Landscape
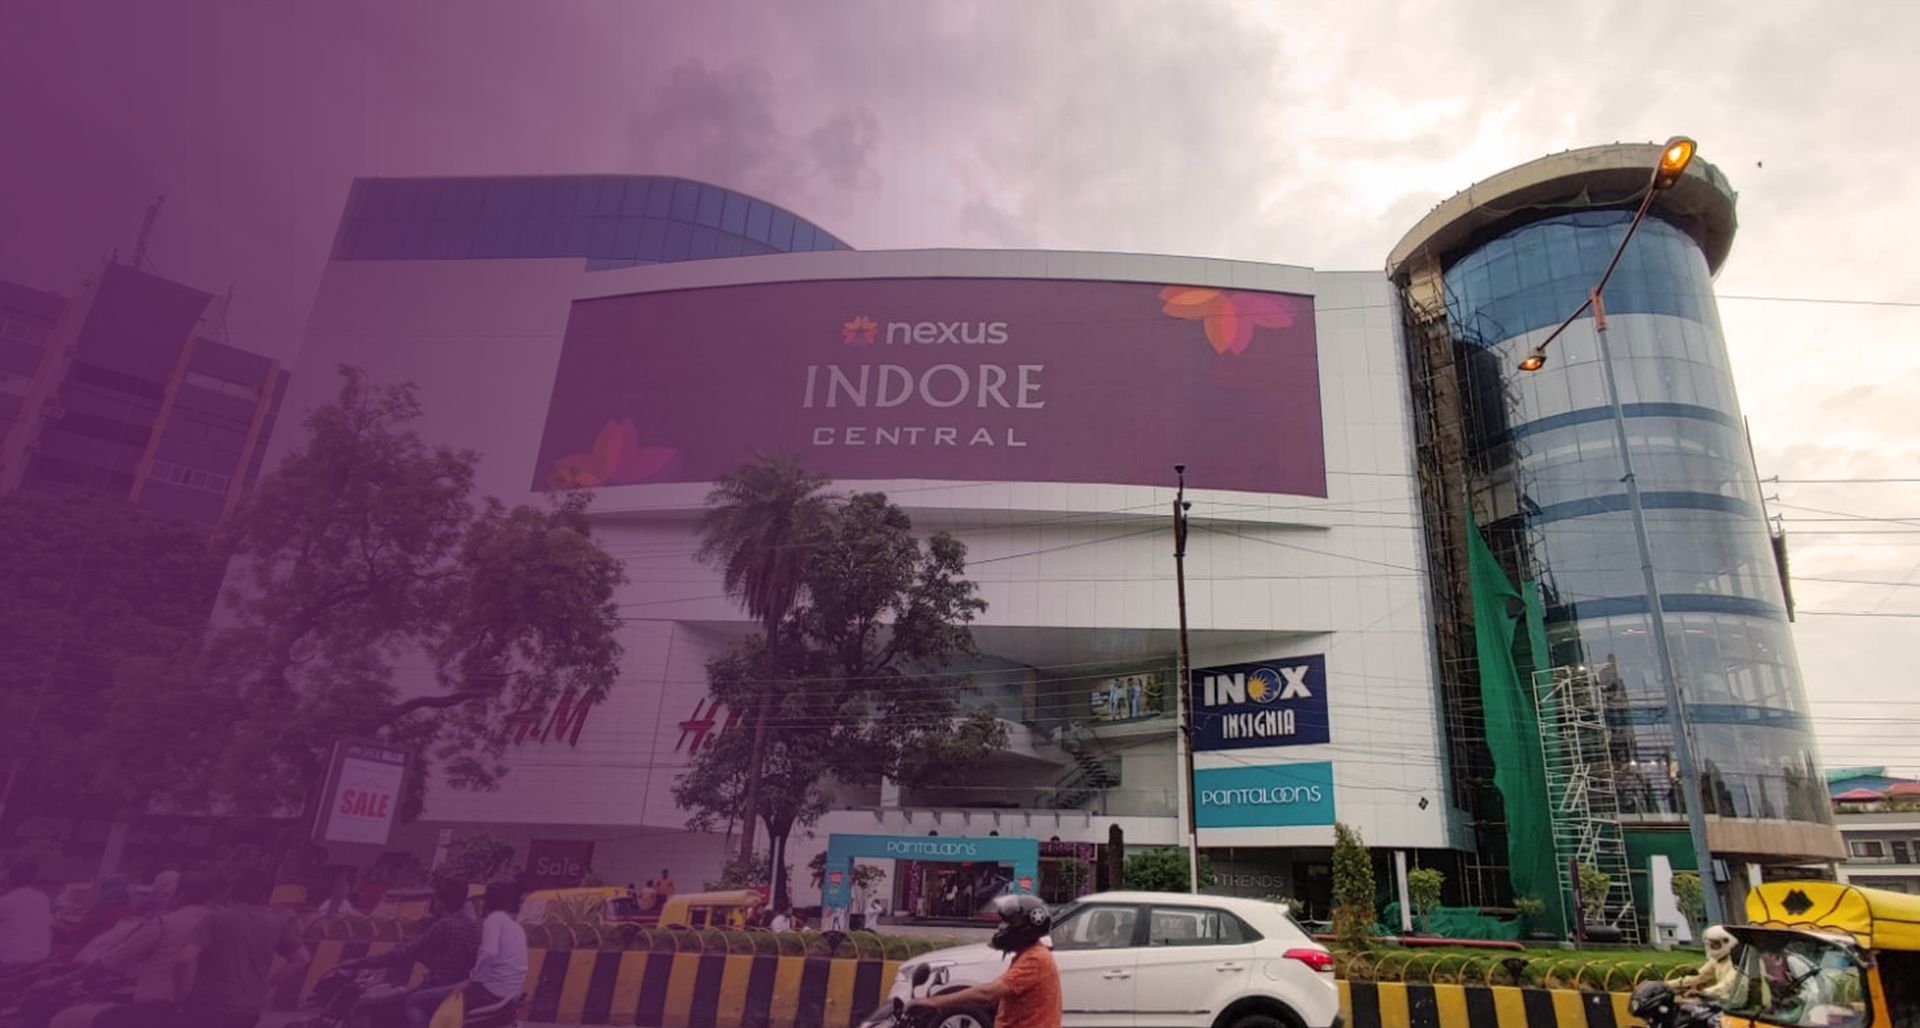
Treasure Island Mall competes directly with Nexus Indore Central, a 500000 square foot property opened in 2013 with 98 percent occupancy and 12 million annual footfalls, as well as C21 Mall, in a market with three malls per million population indicating moderate saturation. Emerging high-street formats within 10 km have eroded 15 percent market share since 2020, particularly in apparel where 40 percent of space is allocated, leading to negative 11 percent sales growth in fiscal year 2024. Broader Indore retail faces tier-two challenges including 5 percent vacancy rise and e-commerce pressures, with competitor density pressuring footfall distribution and requiring differentiation through tenant mix synergy. Risks include access issues from MG Road congestion and aging infrastructure, which may increase operational costs by 10 to 20 percent for necessary upgrades, while weak electronics categories show lower dwell times and conversion rates below 18 percent average.
Leasing and Operational Metrics
Occupancy at 95 percent with only 7 percent vacancy underscores strong demand, supported by 115 plus tenants and 15 unique concepts, enabling positive 10 to 15 percent re-leasing spreads and average rents of 150 to 200 INR per square foot monthly, or 300 INR per square meter. Lease terms offer flexibility at 3 to 5 years, often with revenue sharing to mitigate fixed rent risks in volatile markets. Operational strengths include efficient Nexus management with full digital signage coverage, 50 promotional events yearly boosting loyalty program penetration to 40 percent of visitors, and security via CCTV and guards limiting shrinkage to 2.5 percent. However, drawbacks encompass a 20 percent year-over-year footfall decline to 3 million in the last twelve months from 11 million peaks, dwell time of 120 minutes notwithstanding, and projected 8 percent growth tempered by seasonal 5 to 10 percent dips. Capital needs for modernization address 20-year-old infrastructure weaknesses, ensuring competitiveness in a market with 45000 INR sales per square meter and 18 percent conversion.
Building Details
Detailed Market Analytics
City Snapshot
Indore, MP
Comprehensive market intelligence for retail expansion in this city

Other Retail Destinations in Indore
Discover more shopping centers in Indore.



Popular in India
Top retail destinations across India.



Interested in this property?
Choose how you'd like to proceed
Advertise at this property?
Reach high-intent shoppers across digital screens, atria, and experiential placements.
City Snapshot
Indore, MP
Comprehensive market intelligence for retail expansion in this city