





Brand Fit Snapshot
Best for:
Not ideal if:
Similar properties you might like:
Quick assessment - takes 30 seconds
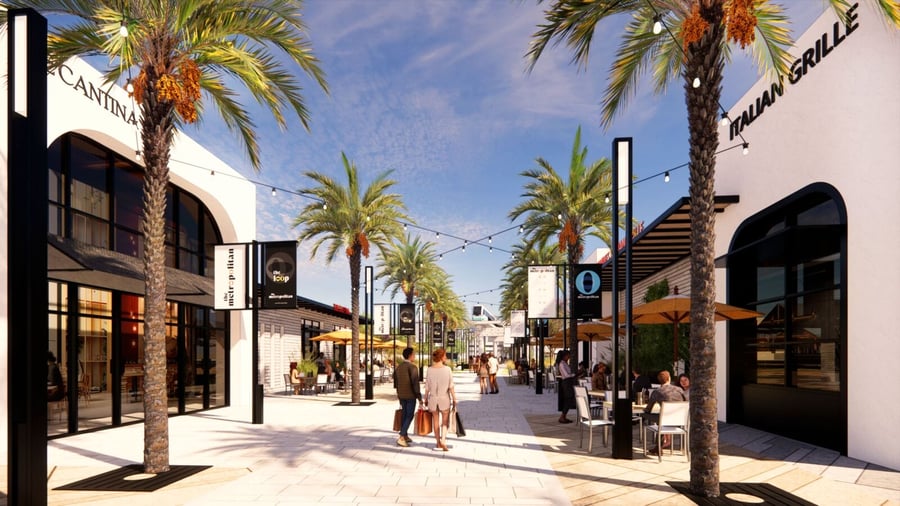
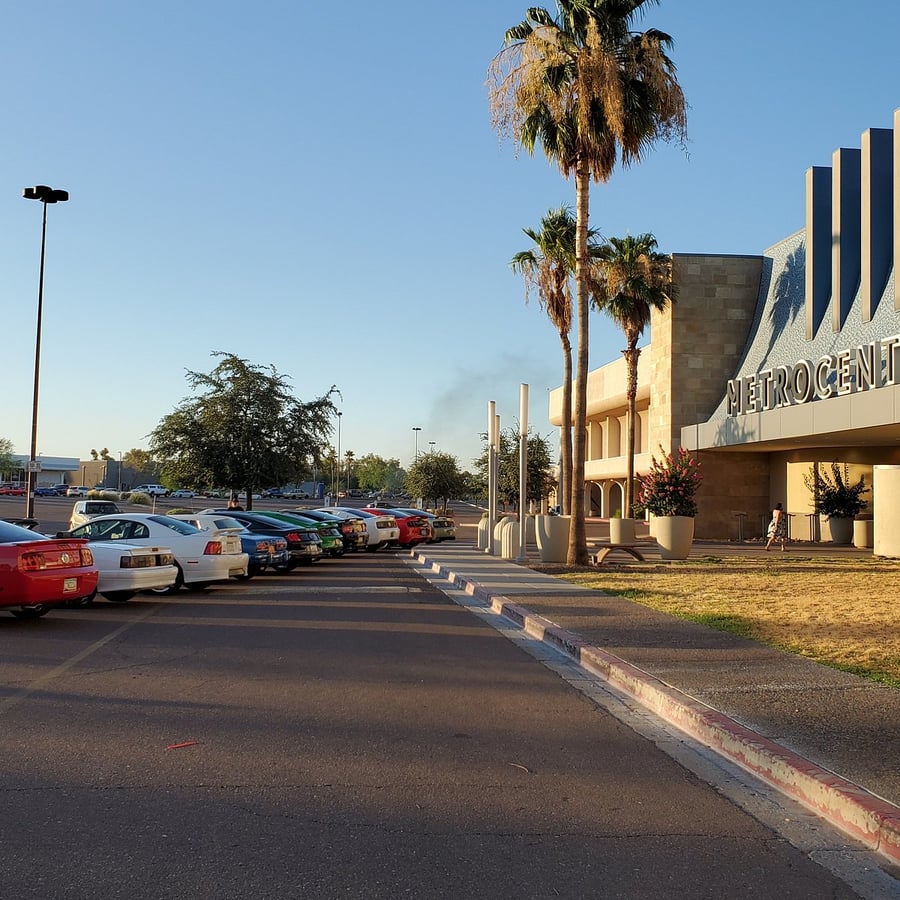
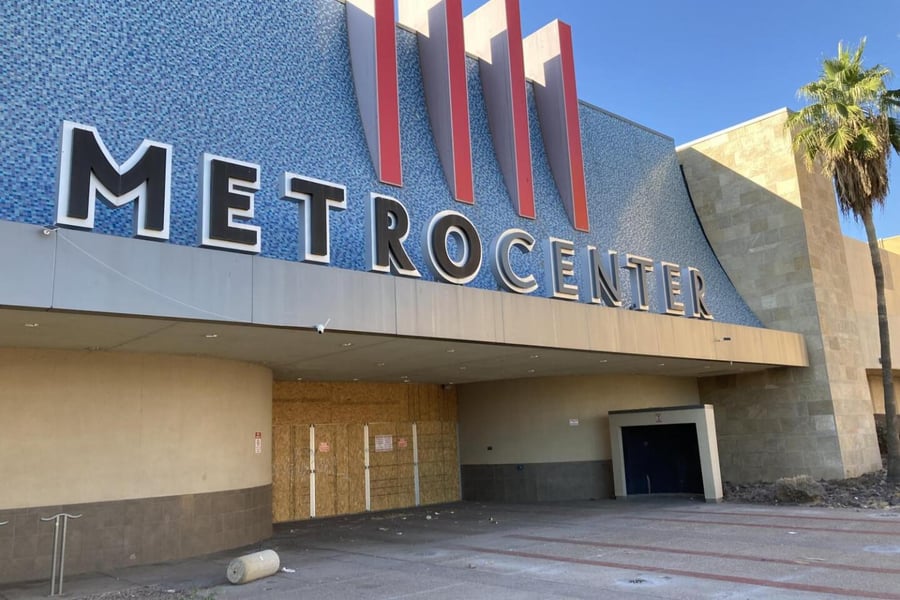
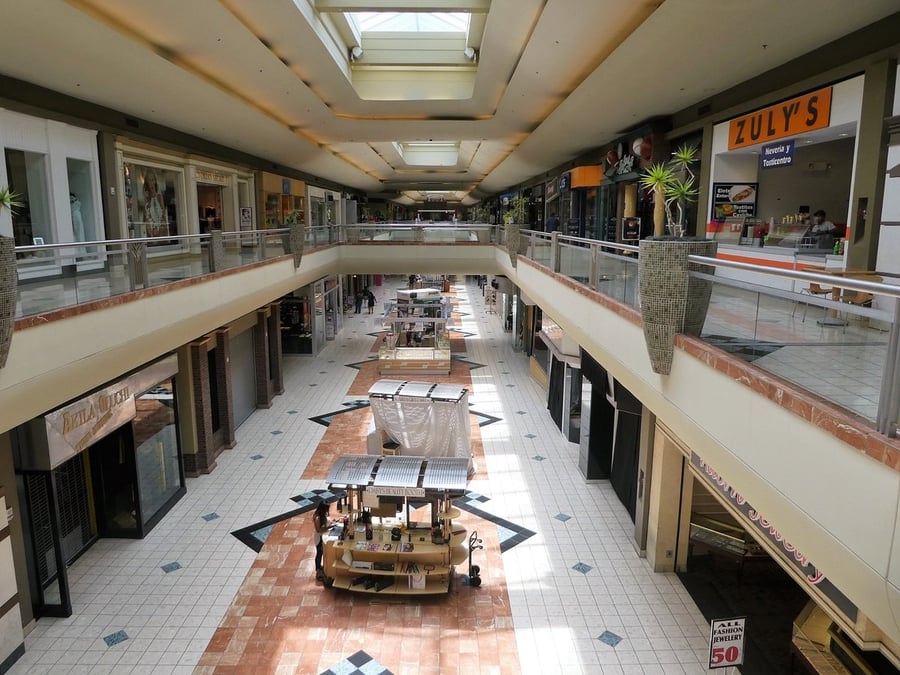
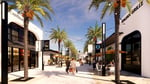
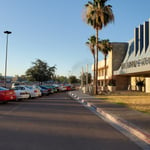
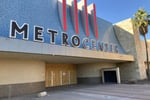
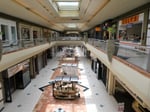
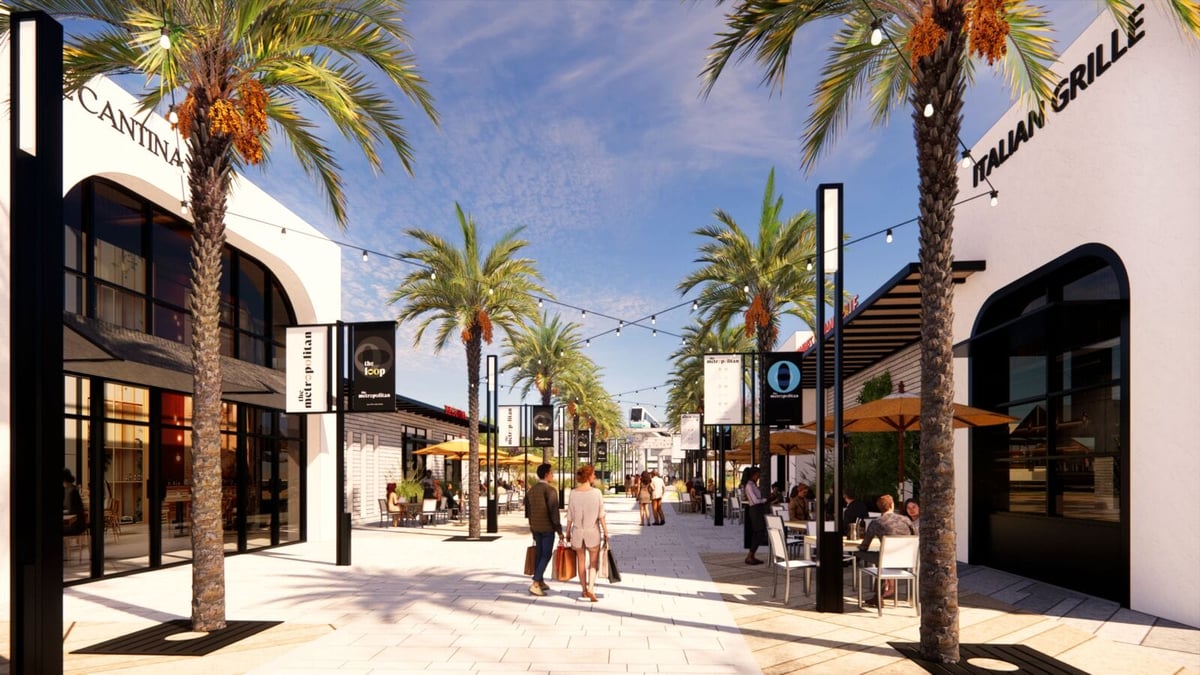
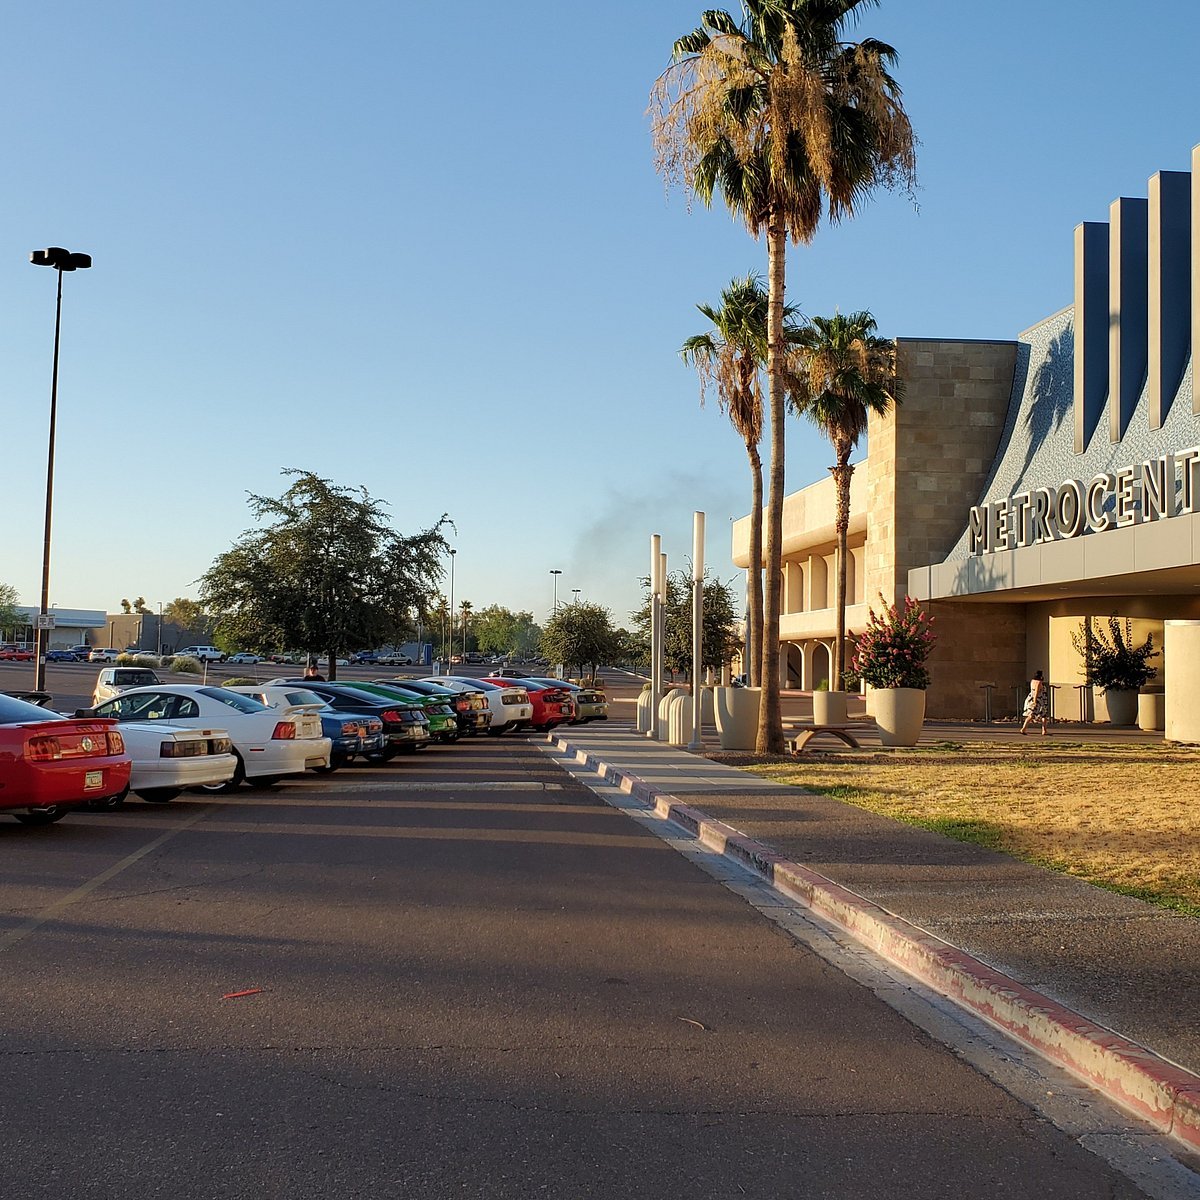
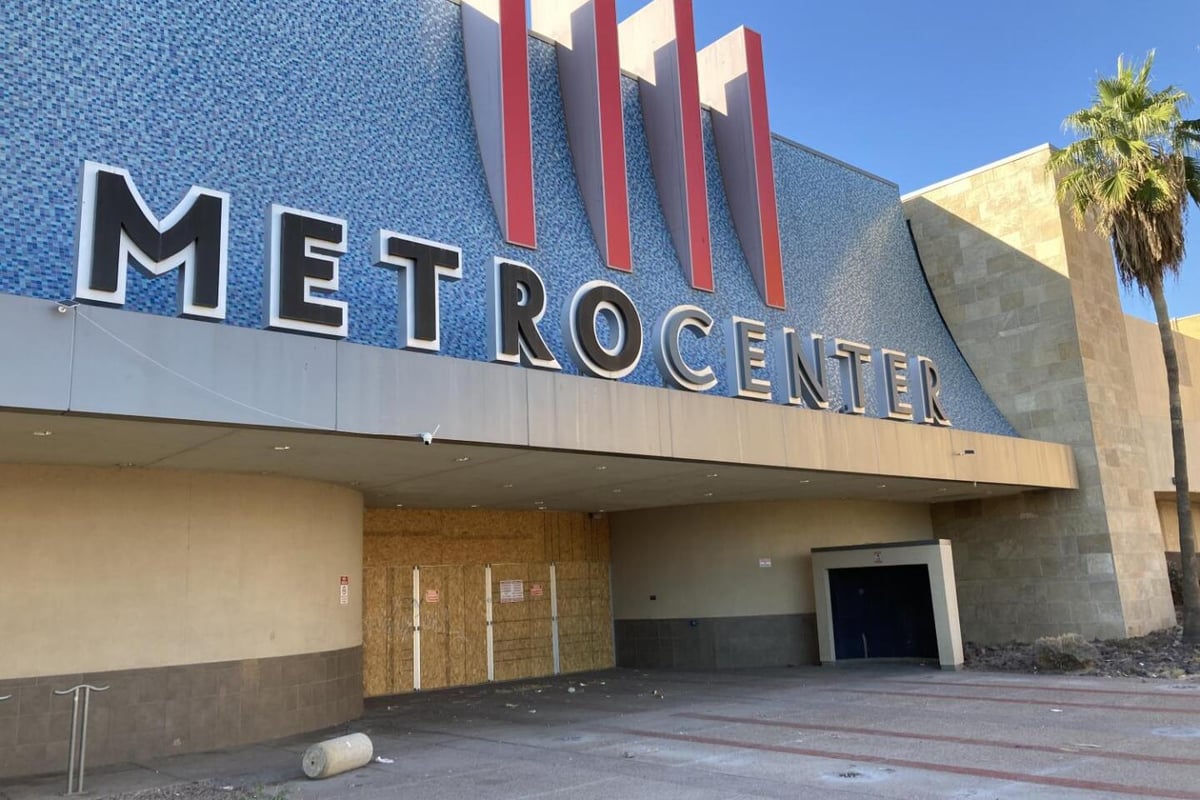
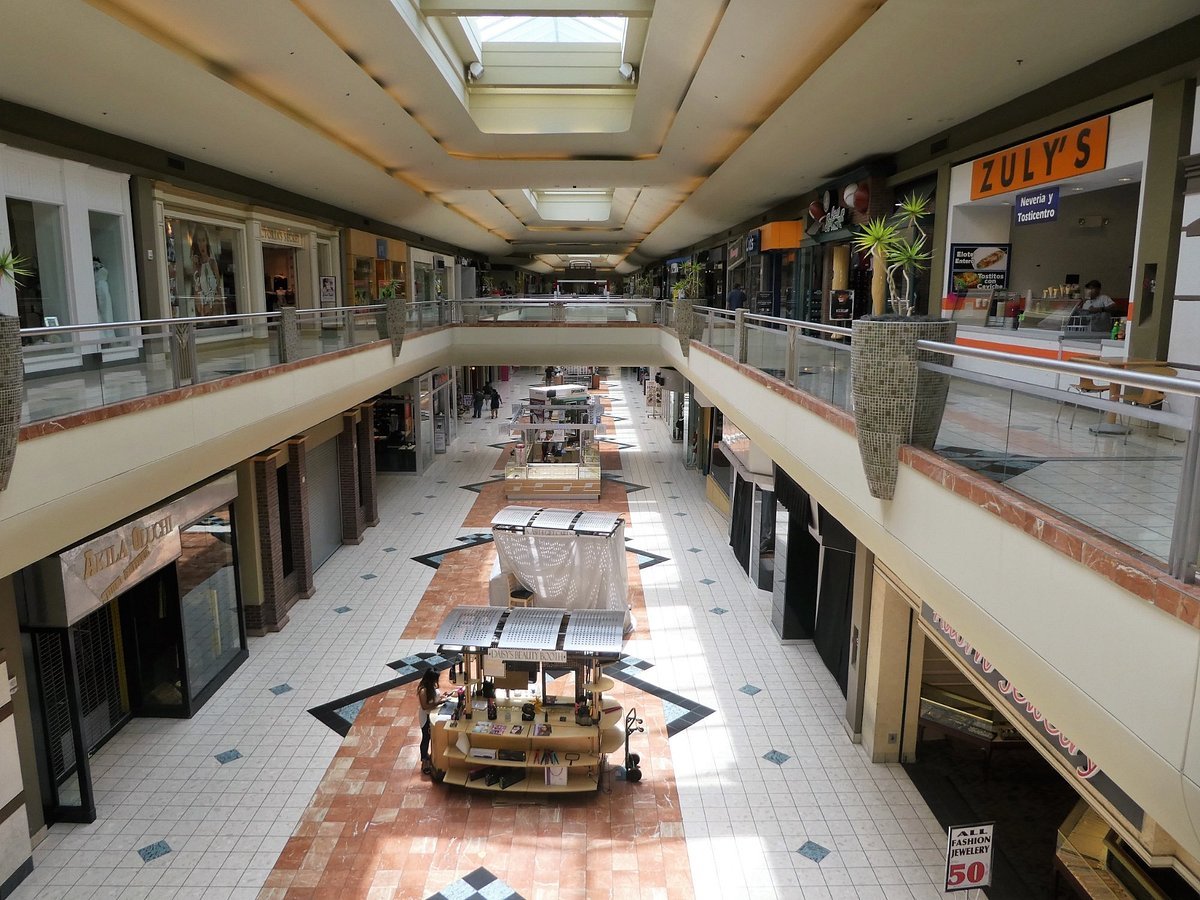
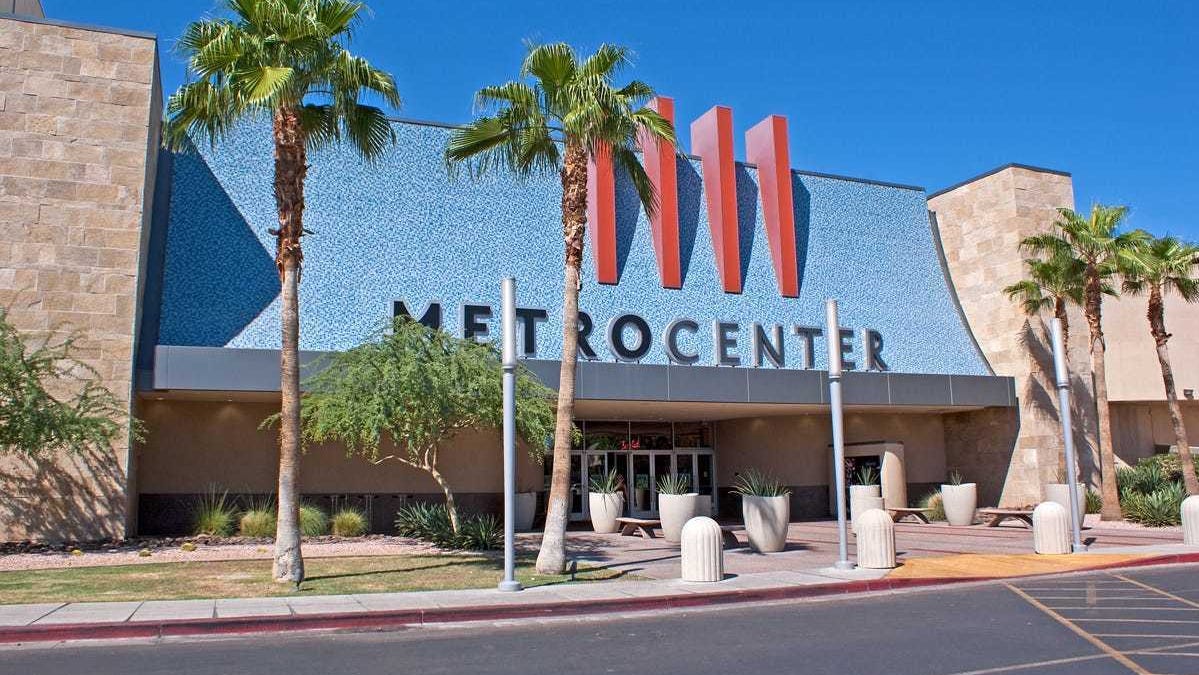
The former Metrocenter Mall in Phoenix, Arizona, opened in 1973 as the states largest enclosed shopping center with over 1.3 million square feet of retail space and anchors including Sears, JCPenney, and Macy's. It served north Phoenix for decades but faced declining footfall due to e-commerce shifts and anchor store closures, leading to its permanent closure in June 2020. The 64-acre site, located at 9617 North Metro Parkway West, is now the focus of an $850 million redevelopment project called The Metropolitan, transforming it into a mixed-use urban village.
Demolition concluded in September 2025, with construction commencing in early 2026 across phased developments. Plans include up to 3,000 multifamily residential units, 115,000 square feet of retail and restaurant space, office components, and green public areas, all integrated with Valley Metro light rail for enhanced accessibility. The surrounding area features a 5-mile radius population of approximately 220,000, with a median household income of $65,000, diverse demographics including 40% Hispanic residents, and a mix of families and young professionals.
This positions The Metropolitan as a neighborhood hub in a growing metro with 1.5% annual population increase. Retail leasing opportunities emphasize ground-floor spaces for experiential tenants, potentially at Phoenix average rents of $20-25 per square foot on a triple net basis. Advantages include revitalization potential and proximity to I-17 highway, though the transition from mall to open-air format requires adaptive strategies amid ongoing market saturation in big-box retail.
Interested in this property?
Choose how you'd like to proceed
Advertise at this property?
Reach high-intent shoppers across digital screens, atria, and experiential placements.
Hours of Operation
Hours
| Monday | Closed |
| Tuesday | Closed |
| Wednesday | Closed |
| Thursday | Closed |
| Friday | Closed |
| Saturday | Closed |
| Sunday | Closed |
Hours may vary on public holidays. Check with individual stores for specific holiday schedules.
Insights
Demographics and Accessibility
The redevelopment site in north Phoenix targets a 5-mile trade area with 220,000 residents, median age 35, and household income averaging $65,000, supported by a 25% millennial demographic drawn to urban lifestyles. Accessibility is strong via direct light rail connection at the future Peoria Avenue station, reducing car dependency, and I-17 interchange within 1 mile, facilitating regional draw. Projected footfall could reach 5-7 million annual visitors post-completion, bolstered by residential density generating daily traffic. However, current construction may limit immediate access, and competition from established centers like Park West could dilute initial capture rates in this middle-market segment.
Tenant Mix and Retail Opportunities
Planned tenant mix for the 115,000 square feet of retail space prioritizes dining, services, and boutique shops to complement residential and office uses, fostering a synergistic ecosystem unlike the former malls big-box dominance. Early leasing targets experiential retailers to activate street-level spaces, with opportunities for pop-ups during phasing. Occupancy is projected at 70% by 2028, aligned with Phoenixs robust retail absorption of 500,000 square feet annually. Strengths include customizable lease terms for smaller formats under 5,000 square feet, capitalizing on the areas 85% small-space demand, though saturation in casual dining categories poses challenges to achieving premium positioning.
Risks and Operational Considerations
Key risks include construction delays potentially pushing full occupancy to 2029, exposing early tenants to low footfall and higher-than-average Phoenix vacancy rates of 6-8%. Aging infrastructure is no longer an issue post-demolition, but integration with light rail timelines remains uncertain. Lease terms may feature escalating rents starting at $18-22 psf NNN, with concessions for build-out costs up to $50 psf, reflecting market norms. Operational quality will depend on developer NFP Propertys track record in similar projects, yet external factors like economic slowdowns in retail could amplify competition from 10 nearby centers, necessitating strong category differentiation to mitigate performance volatility.
Building Details
Detailed Market Analytics
City Snapshot
Phoenix, AZ
Comprehensive market intelligence for retail expansion in this city

Other Retail Destinations in Phoenix
Discover more shopping centers in Phoenix.

Popular in United States
Top retail destinations across United States.



Interested in this property?
Choose how you'd like to proceed
Advertise at this property?
Reach high-intent shoppers across digital screens, atria, and experiential placements.
City Snapshot
Phoenix, AZ
Comprehensive market intelligence for retail expansion in this city