















Brand Fit Snapshot
Best for:
Not ideal if:
Similar properties you might like:
Quick assessment - takes 30 seconds
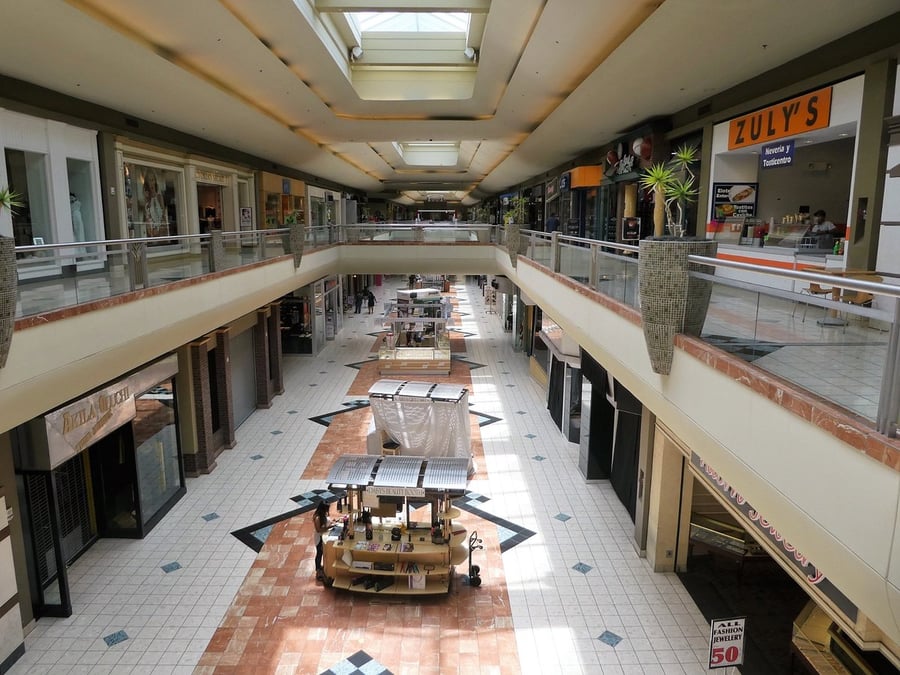
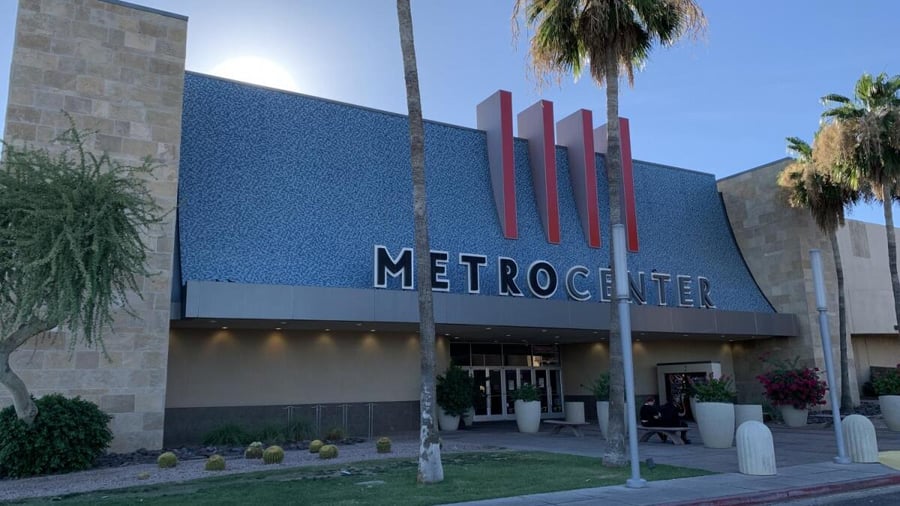
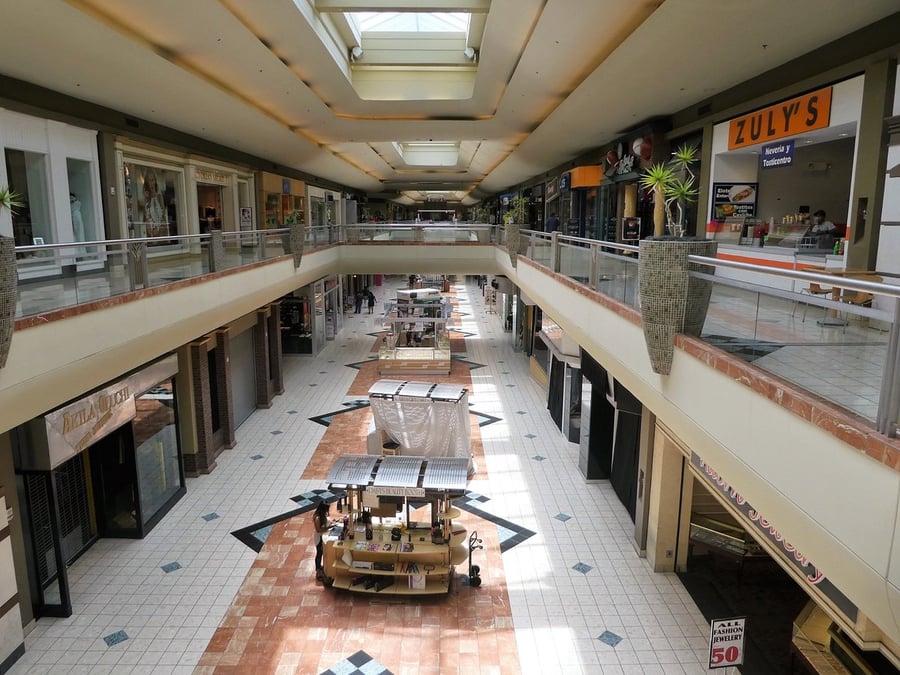
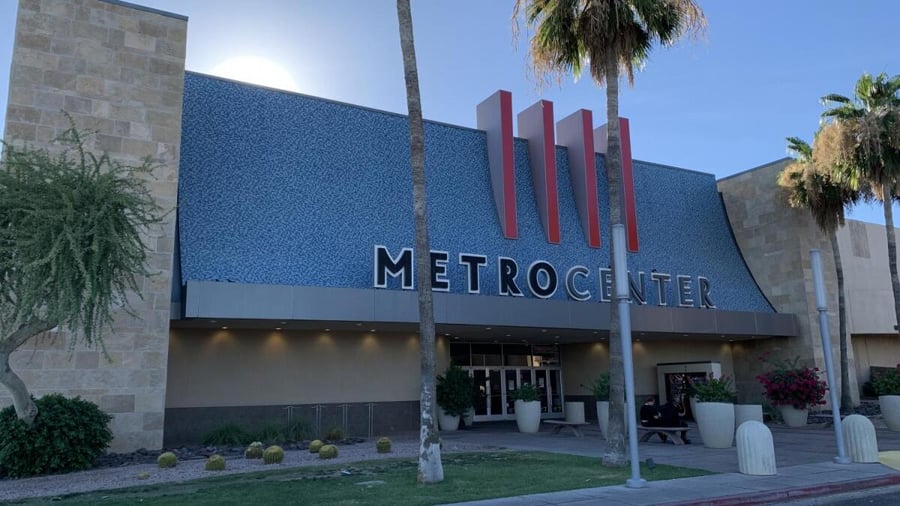
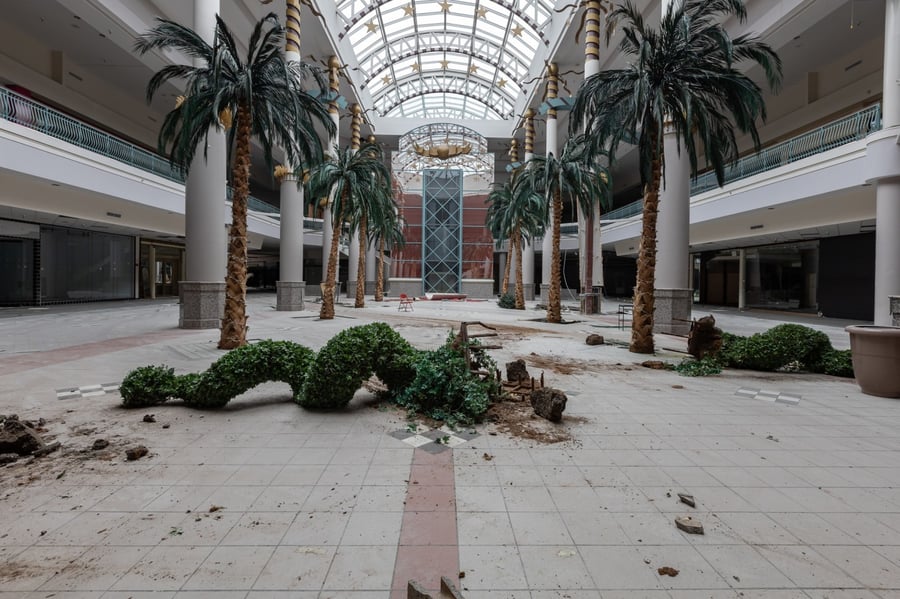
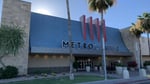
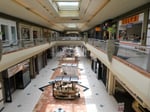
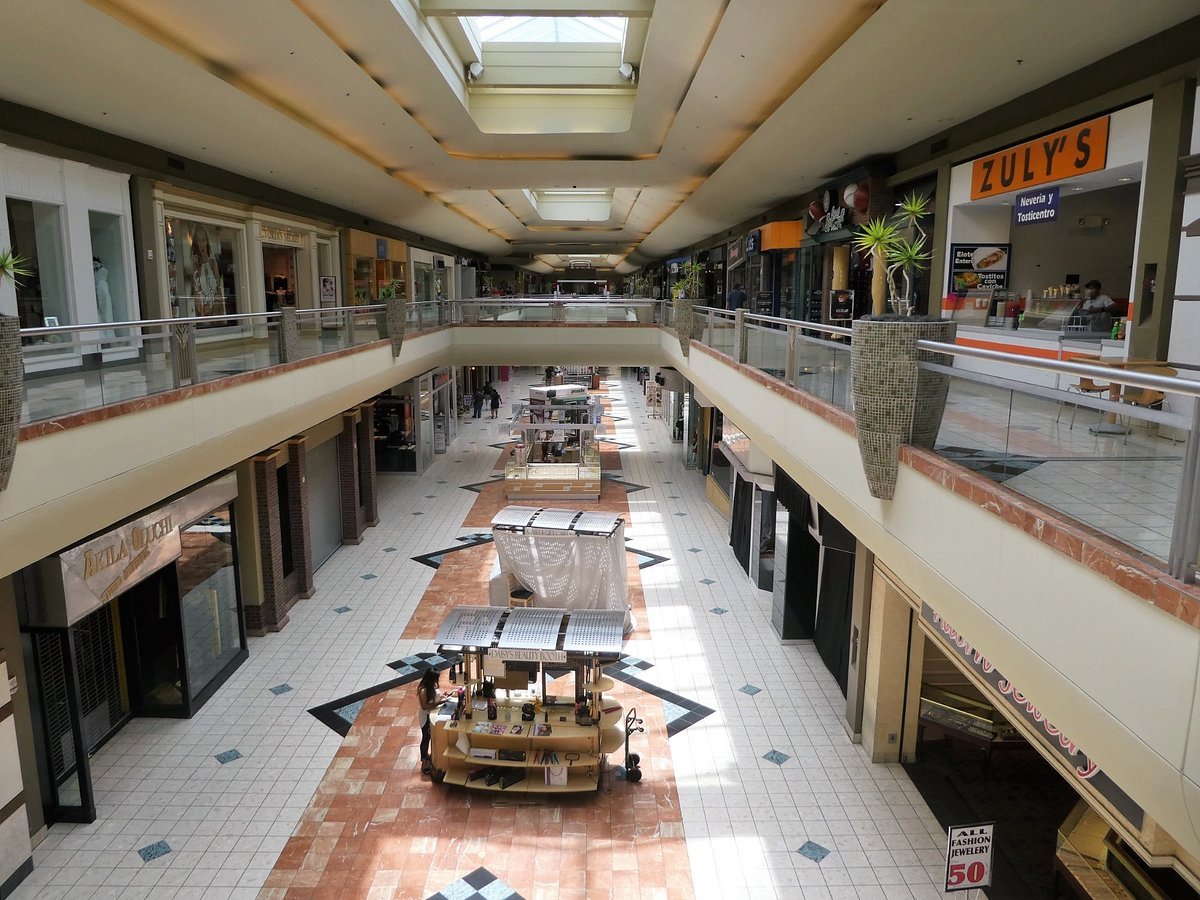
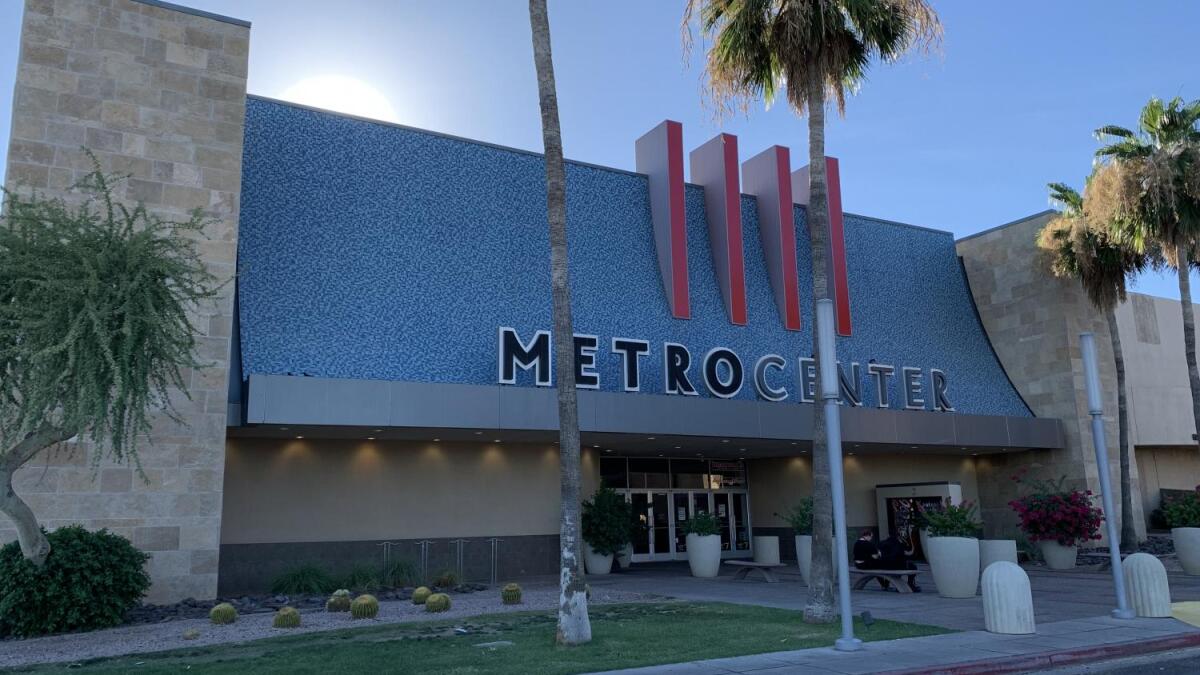
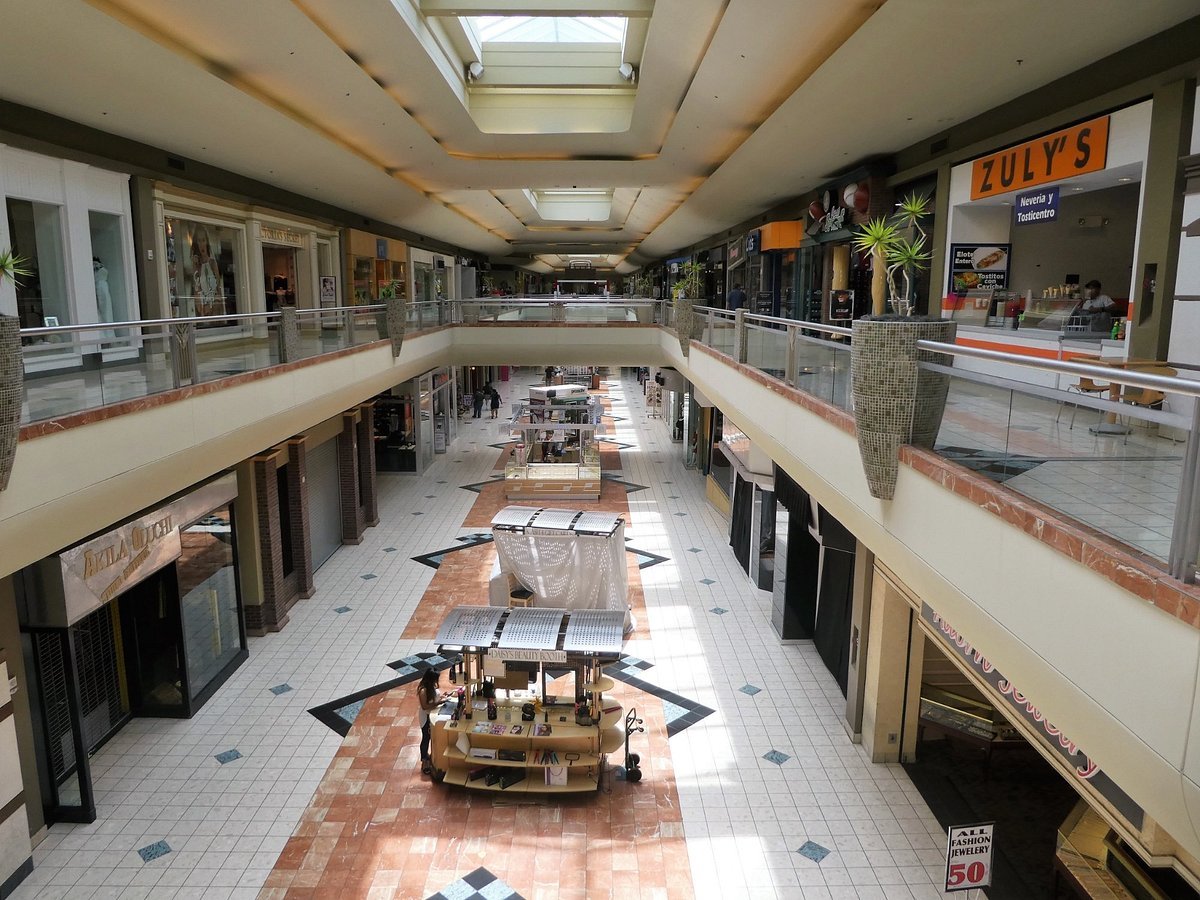
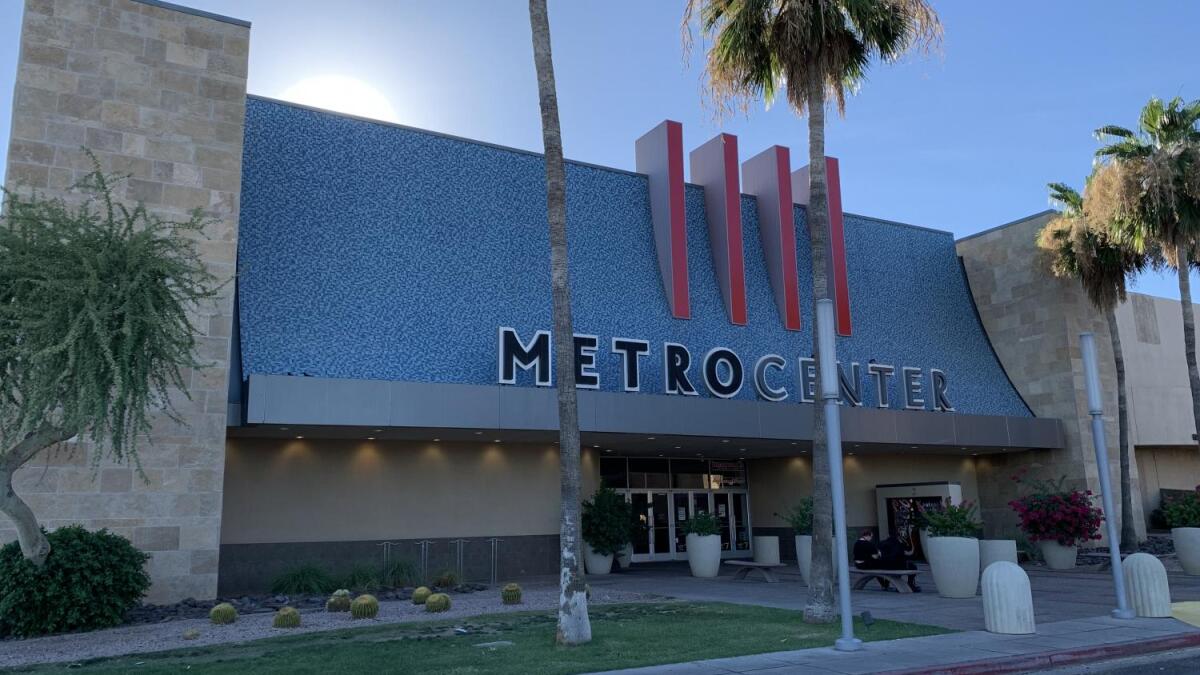
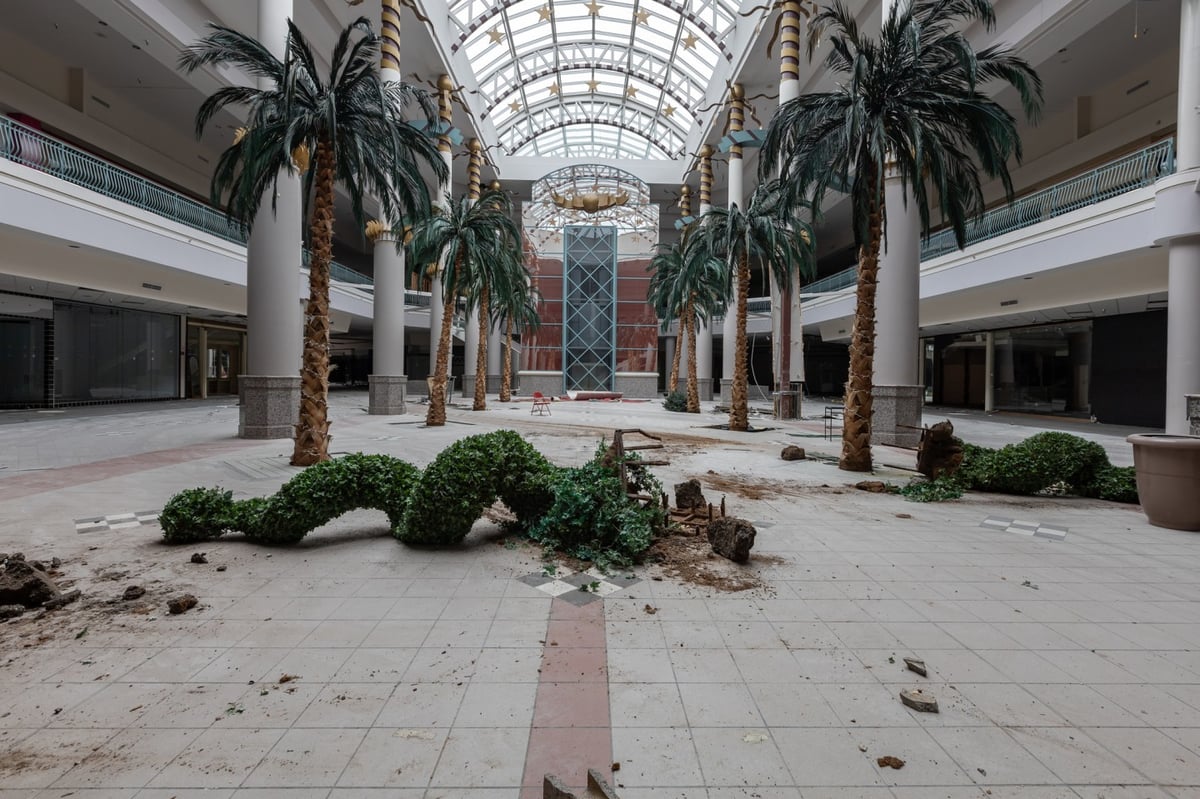
Metrocenter, located at the intersection of Interstate 17 and Peoria Avenue in north Phoenix, Arizona, was a prominent enclosed shopping mall that opened in 1973 and spanned 1.3 million square feet. It served as one of the largest malls in the Southwest until its closure on June 30, 2020, due to declining footfall, anchor tenant departures, and shifts in retail trends toward open-air centers. The property, previously anchored by Macy's, Sears, and JCPenney, experienced high vacancy rates exceeding 50% in its final years, reflecting broader challenges in traditional mall formats amid e-commerce growth and suburban migration.
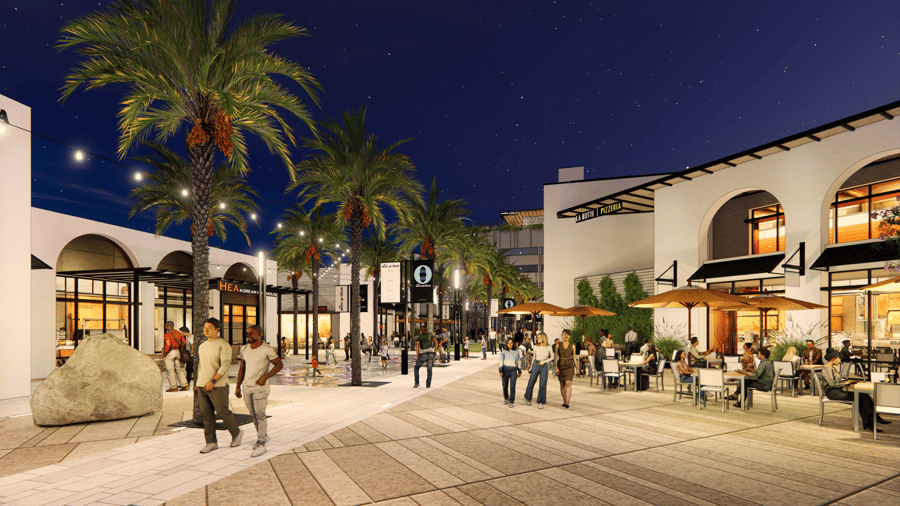
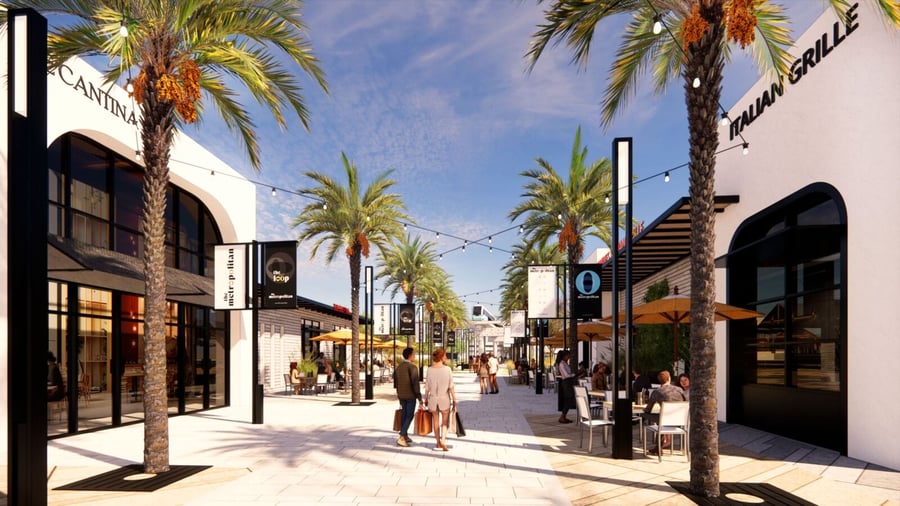
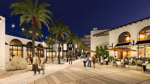
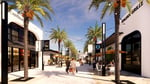
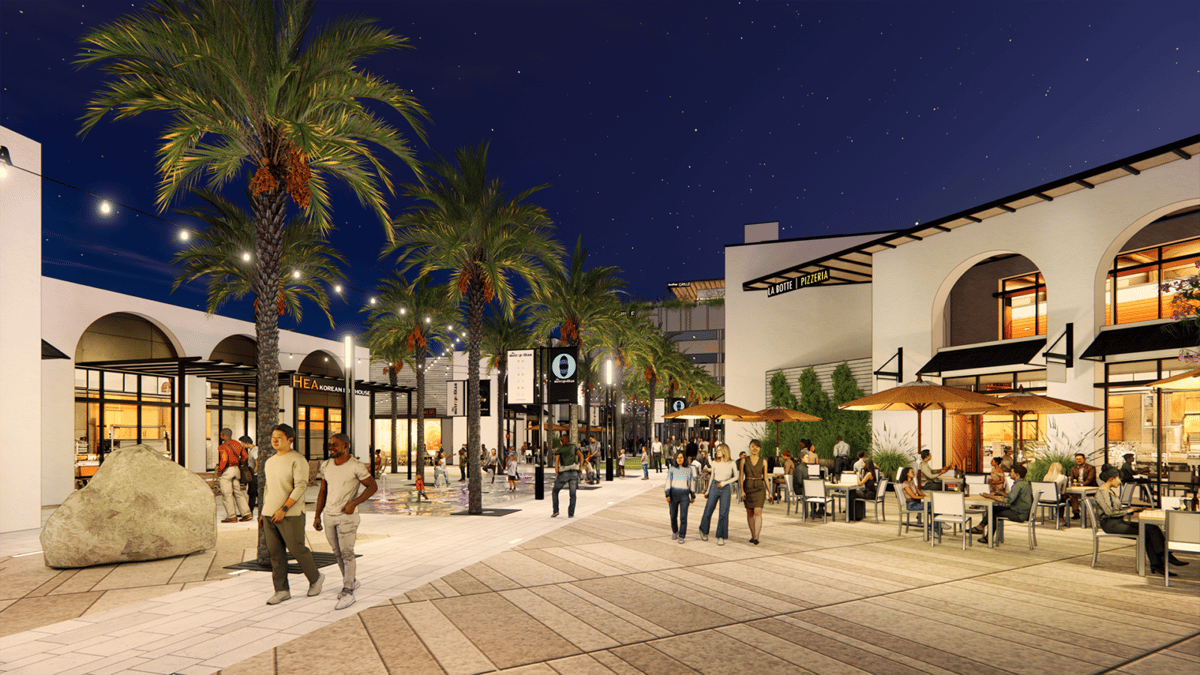
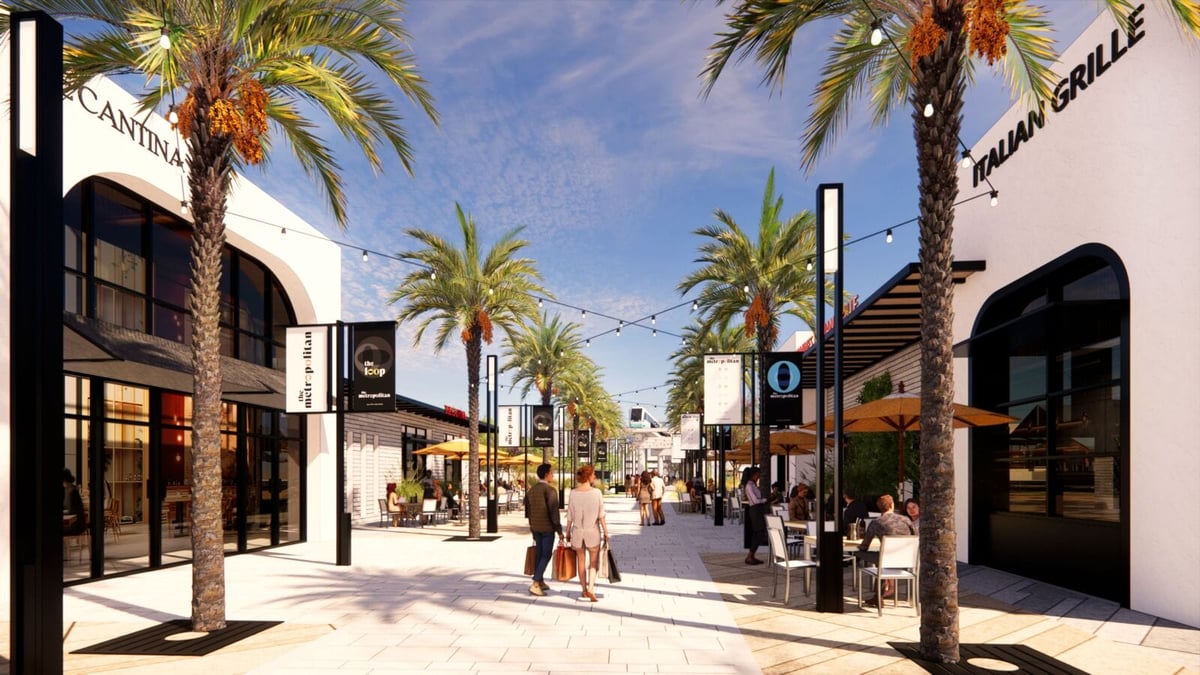
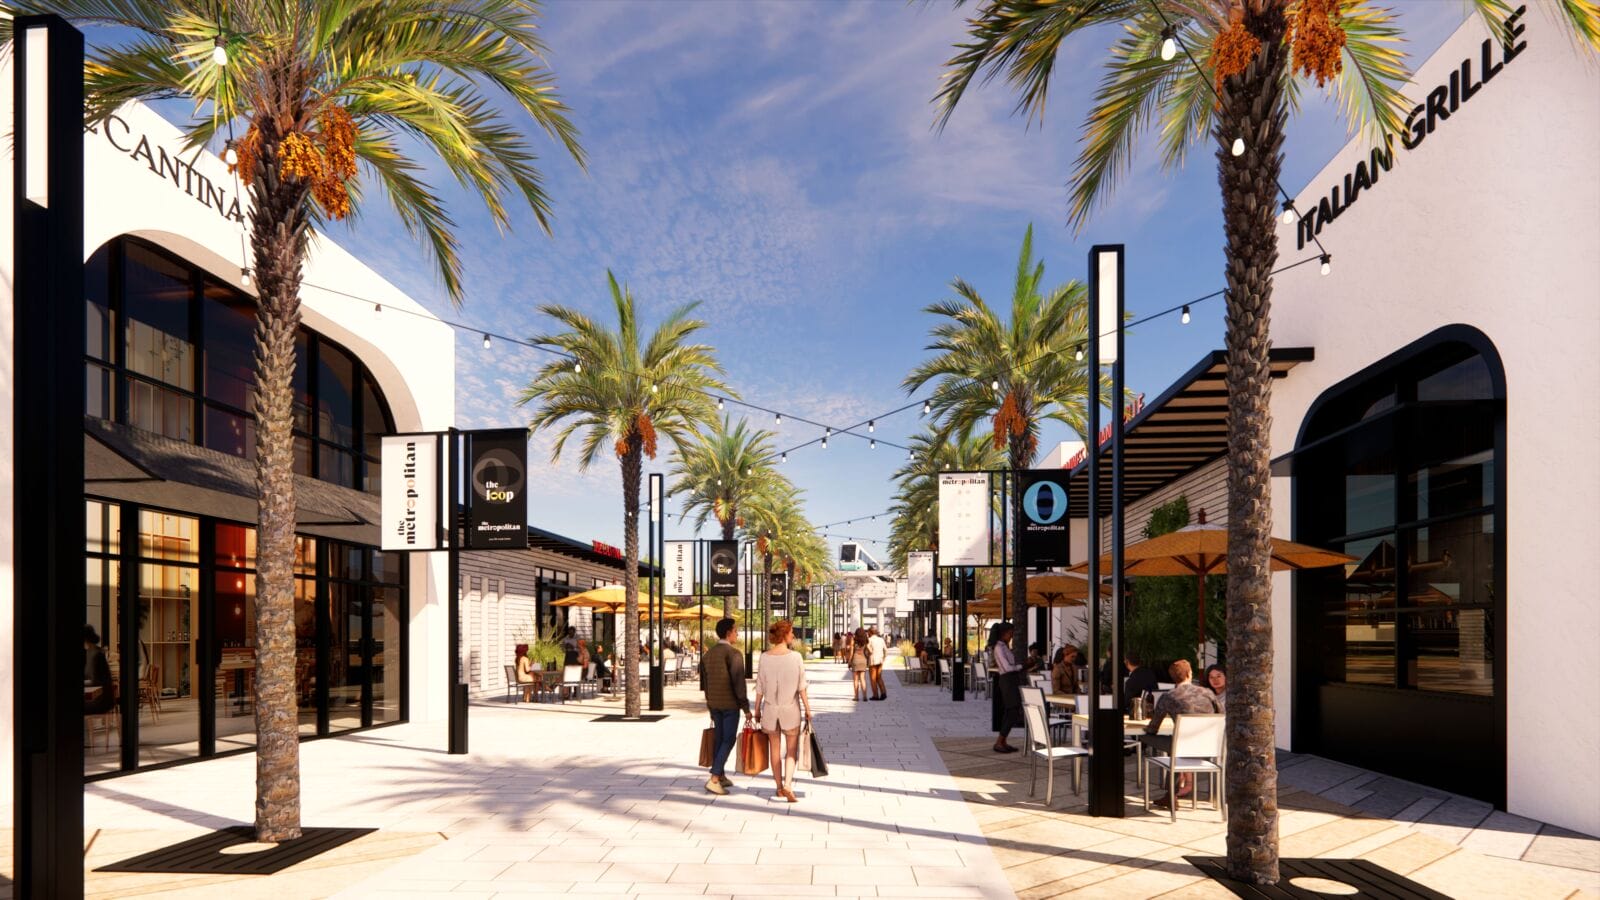
As of 2025, the site has undergone complete demolition and is undergoing an $850 million redevelopment by Concord Wilshire Capital into a mixed-use urban village called The Metropolitan. This project includes over 1,100 residential units (primarily townhomes and apartments), 200,000 square feet of retail and restaurant space, entertainment venues, and office components, with construction commencing in 2026 and phased openings targeted for 2027-2028.
Phoenix's retail market remains robust, with overall vacancy at 5.1% in Q1 2025 per Cushman & Wakefield reports, driven by population growth exceeding 1.5% annually and household incomes averaging $75,000 in the north Phoenix area. The redevelopment positions Metrocenter as a revitalized destination integrating residential density to boost captive footfall for retailers.
Leasing advantages include ground-floor retail in a pedestrian-friendly layout, proximity to major highways for accessibility, and synergy with new housing to ensure steady local traffic. However, the multi-year construction timeline delays immediate occupancy, and the tenant mix will emphasize experiential retail, dining, and services to align with market preferences for omnichannel experiences.
Operational quality will benefit from modern infrastructure, contrasting the aging setup of the original mall, but risks involve construction disruptions and competition from established nearby centers.
Overall, this transformation addresses past weaknesses like poor accessibility and outdated design, potentially enhancing retail performance in a high-growth corridor.
Interested in this property?
Choose how you'd like to proceed
Advertise at this property?
Reach high-intent shoppers across digital screens, atria, and experiential placements.
Hours of Operation
Hours
| Monday | Closed |
| Tuesday | Closed |
| Wednesday | Closed |
| Thursday | Closed |
| Friday | Closed |
| Saturday | Closed |
| Sunday | Closed |
Hours may vary on public holidays. Check with individual stores for specific holiday schedules.
Insights
Demographics and Accessibility
North Phoenix demographics feature a diverse population of approximately 200,000 within a 5-mile radius, with median household income around $72,000 and a mix of families and young professionals, per 2025 U.S. Census data. The area has seen 2.5% annual population growth, supporting retail demand. Footfall potential in the redeveloped site is estimated at 5-7 million annual visitors once fully operational, bolstered by integrated residential units providing built-in traffic. Accessibility is strong via I-17, handling 150,000 daily vehicles, and public transit options including light rail extensions planned by 2028. However, current construction may limit short-term access, and the site's location in a maturing suburban zone faces risks from urban sprawl diverting traffic to emerging developments farther north.
Competition and Tenant Mix
Competing properties include Paradise Valley Mall (redeveloped as an open-air center with 95% occupancy) and Deer Valley Towne Center, both within 10 miles, offering similar mid-tier retail with average rents of $25-35 per square foot. Metrocenter's future tenant mix will prioritize 40% dining and entertainment, 30% lifestyle retail, and 30% services, drawing from successful models like The Shoppes at Norterra, which reports 4% sales growth in 2024. Strengths lie in the mixed-use format fostering longer dwell times, but challenges include market saturation in apparel categories, where national chains have consolidated, and potential oversupply of 500,000 square feet of new retail space in Phoenix by 2027 per CBRE forecasts, pressuring occupancy to below 90% initially.
Leasing Terms and Operational Risks
Lease terms in Phoenix retail average 5-10 year commitments with base rents of $20-30 per square foot for inline spaces in redevelopment projects, including tenant improvement allowances up to $50 per square foot and percentage rent clauses tied to 6-8% of sales. Metrocenter's new build offers modern infrastructure like energy-efficient systems and EV charging, improving operational quality over the original mall's dated facilities that contributed to 20% higher maintenance costs. Risks encompass delays in the 2026-2028 timeline due to supply chain issues, as seen in similar Phoenix projects, and economic sensitivity in a market with 4.2% unemployment. Weak categories like traditional department stores remain vulnerable, while strengths in food and beverage could yield 10-15% higher footfall conversion rates based on ICSC retail benchmarks.
Building Details
Detailed Market Analytics
City Snapshot
Phoenix, AZ
Comprehensive market intelligence for retail expansion in this city

Other Retail Destinations in Phoenix
Discover more shopping centers in Phoenix.

Popular in United States
Top retail destinations across United States.



Interested in this property?
Choose how you'd like to proceed
Advertise at this property?
Reach high-intent shoppers across digital screens, atria, and experiential placements.
City Snapshot
Phoenix, AZ
Comprehensive market intelligence for retail expansion in this city